Calliope Data
Data Viz
UIUX
Dashboard
Data Viz
UIUX
Dashboard
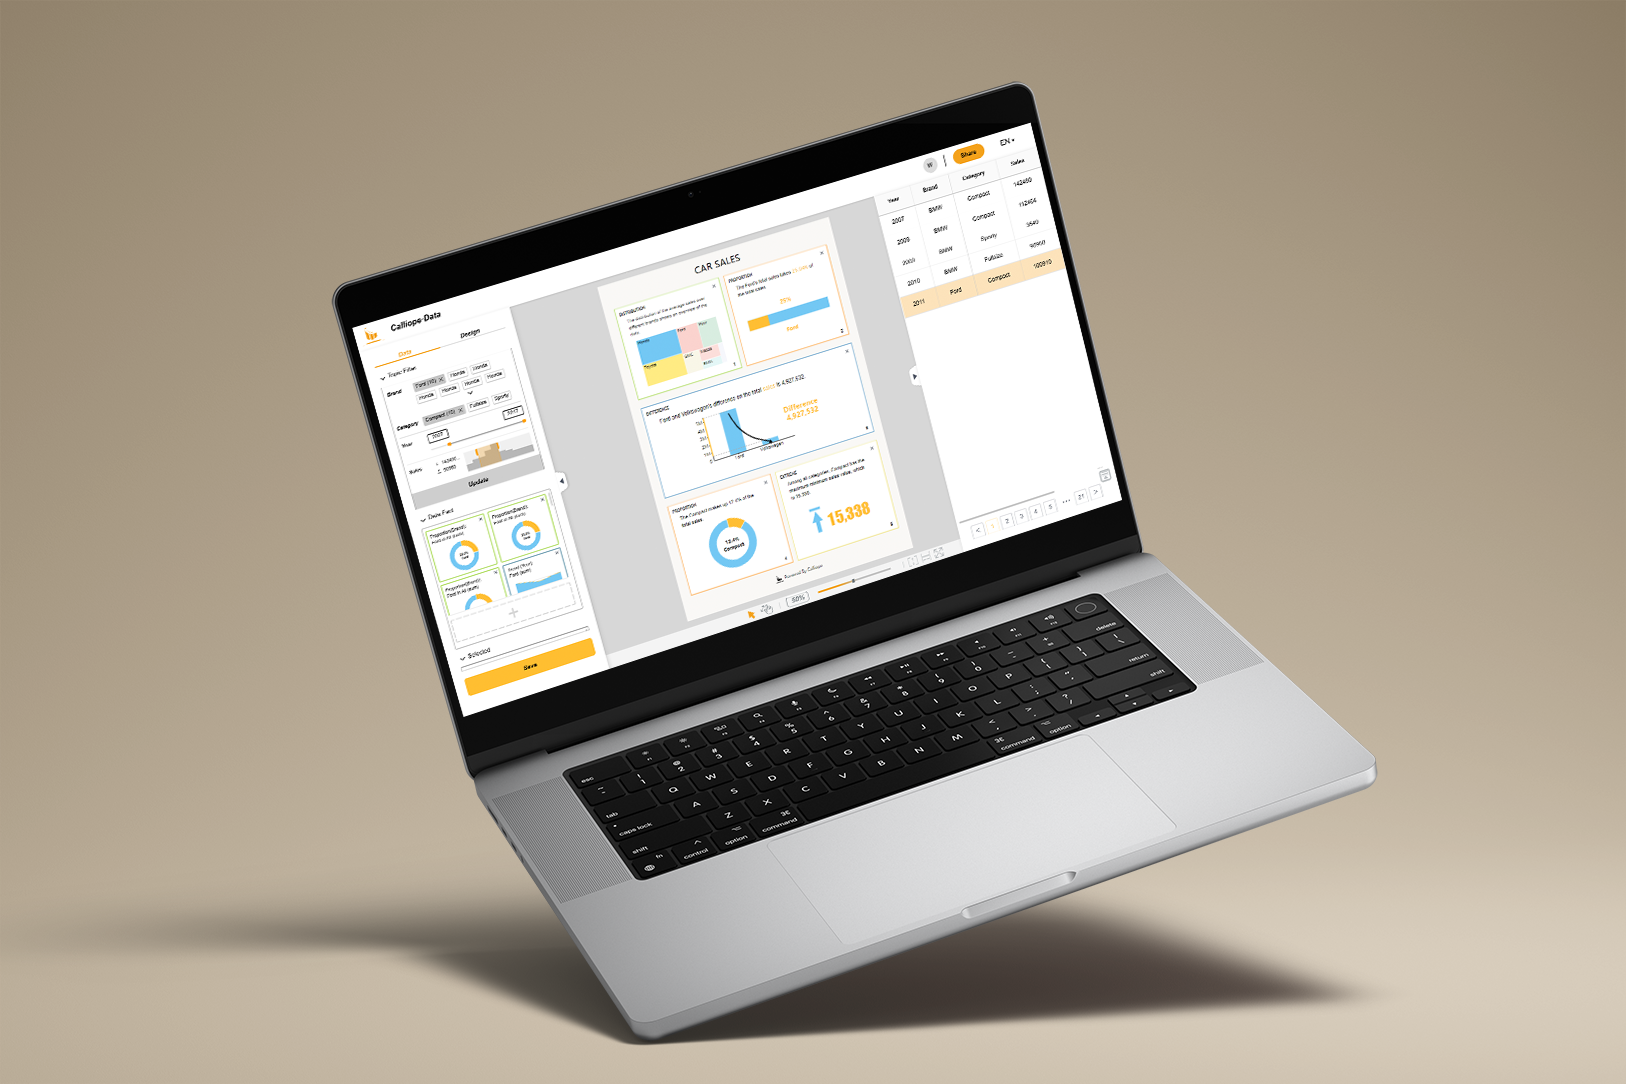
Calliope·Data is an intelligent data auto-insight platform for creating, editing, and sharing your own visual data stories. Users can craft and share their data stories, use Calliope·Data analytics and visualization features to generate an interesting story from any dataset.
Role: UI/UX Time: 3 month
Collab with Tongji iDVx
Role: UI/UX Time: 3 month
Collab with Tongji iDVx
Introduction
Automated story generation
Drag-and-drop your data and the story is ready to be published.
Drag-and-drop your data and the story is ready to be published.
Quick story editing
Interact with your story to refine storyline, text narration, and data insights in a few seconds.
Interact with your story to refine storyline, text narration, and data insights in a few seconds.
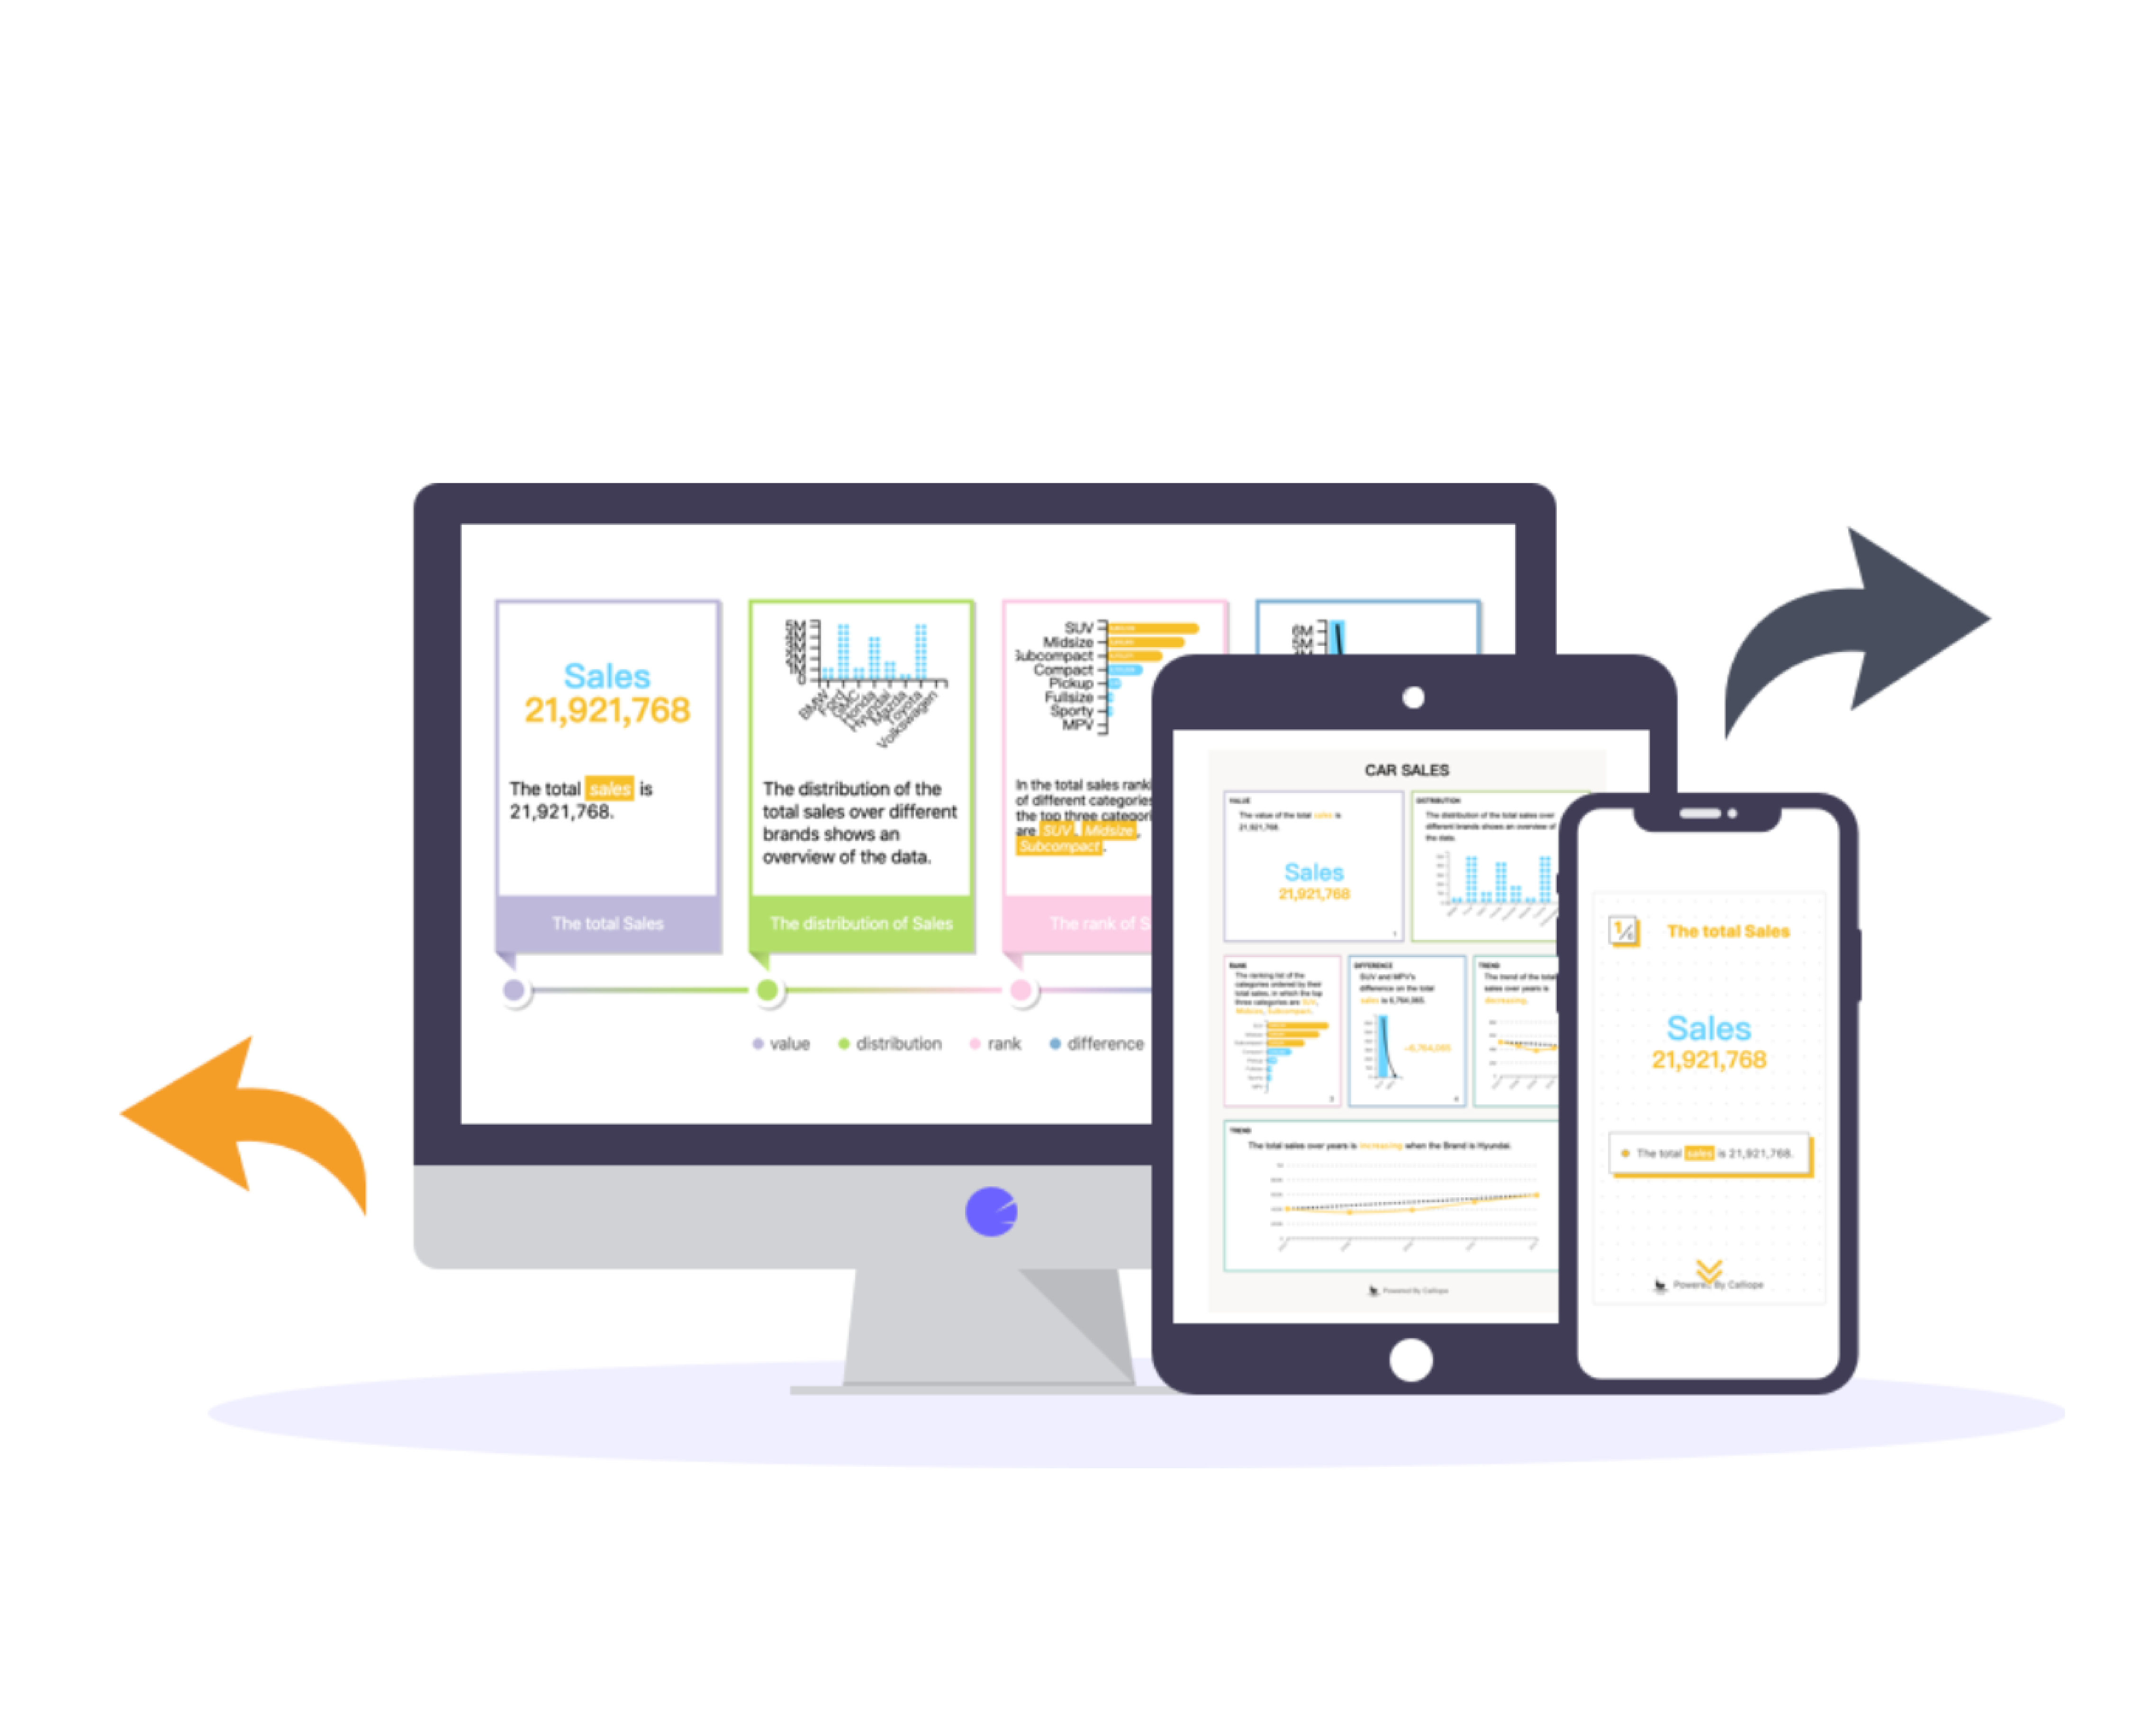
Easy sharing and communication
View your story in professional layouts for various scenarios and share the story with your friends and collaborators via a single click.
View your story in professional layouts for various scenarios and share the story with your friends and collaborators via a single click.


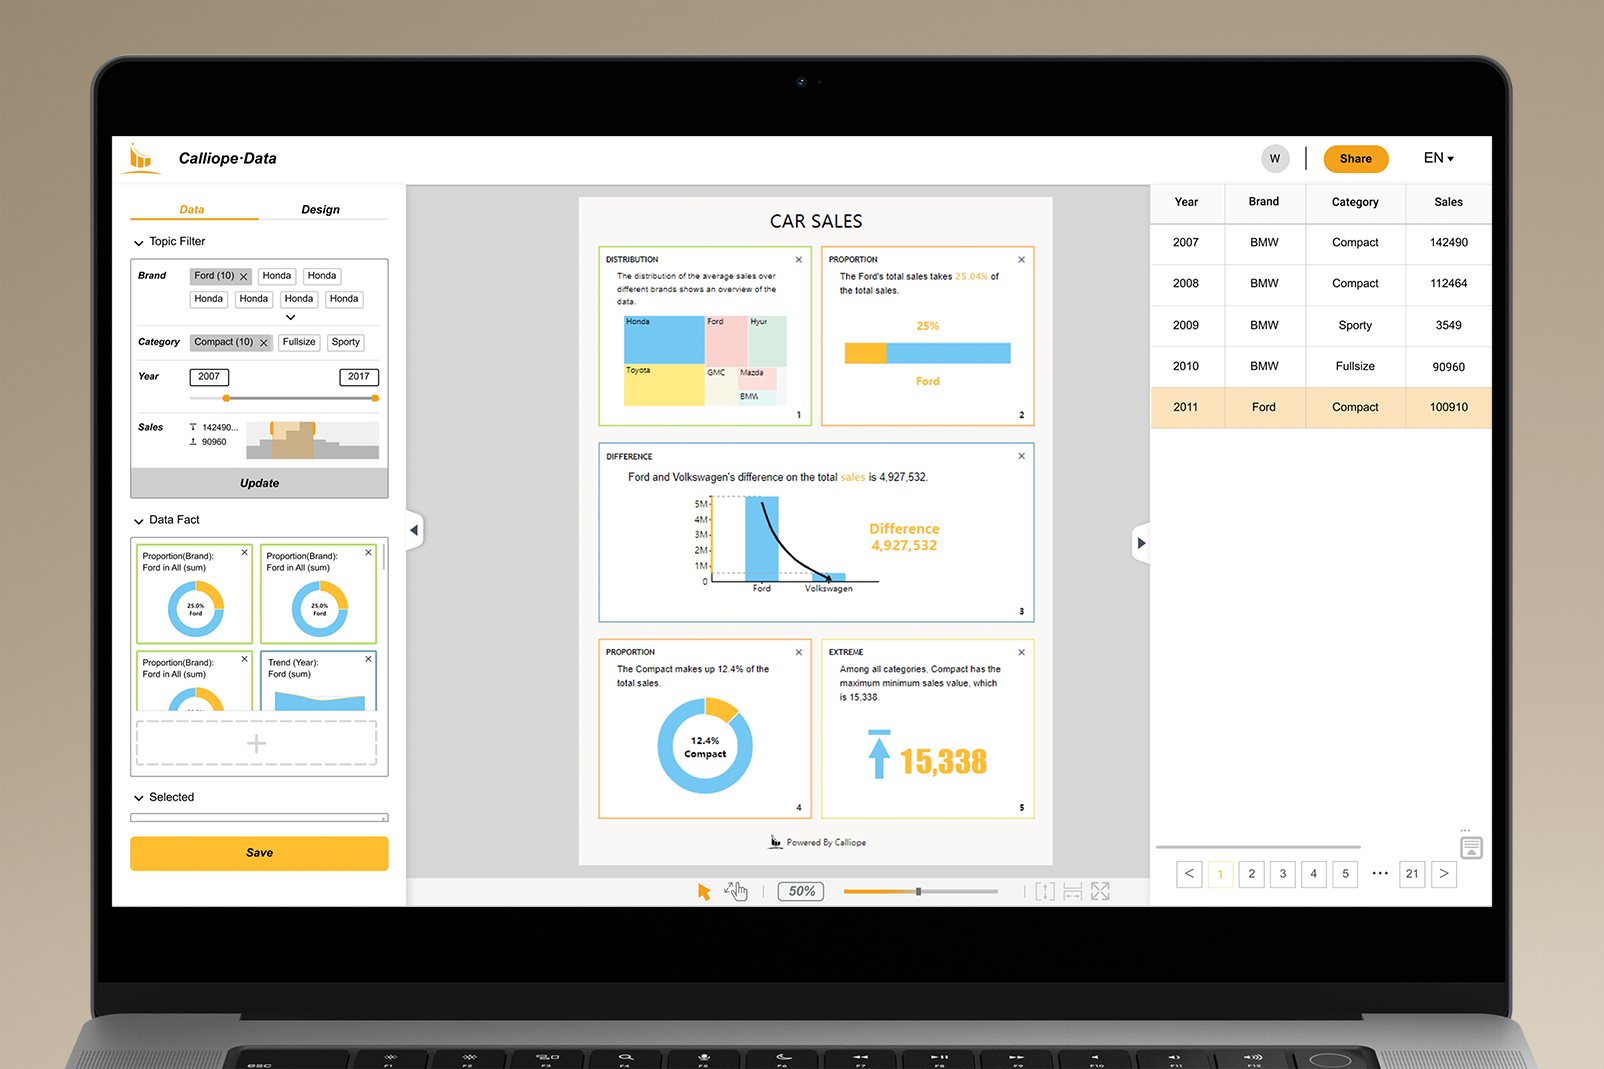
Data Story & Data Fact
Data Story
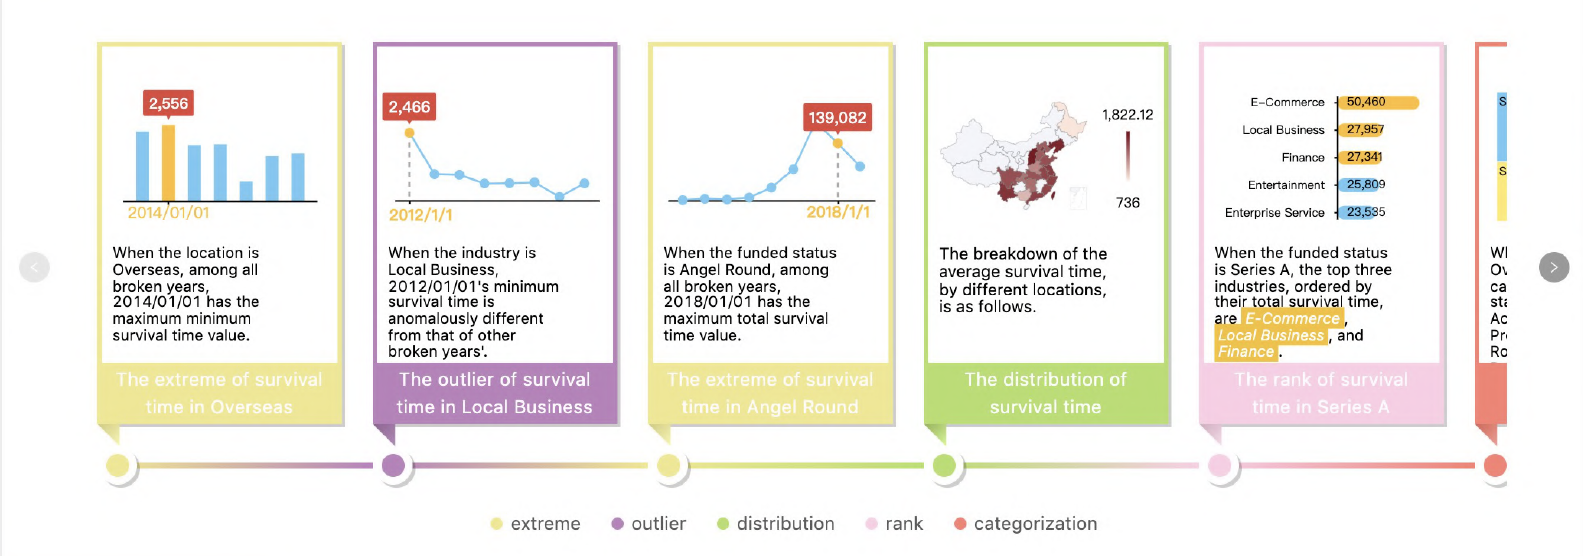
A "data story" is often composed of a series of story pieces, and each story piece is the visualization of a certain data fact.
Storyline mode displays the data stories in a time series chart.
![]()
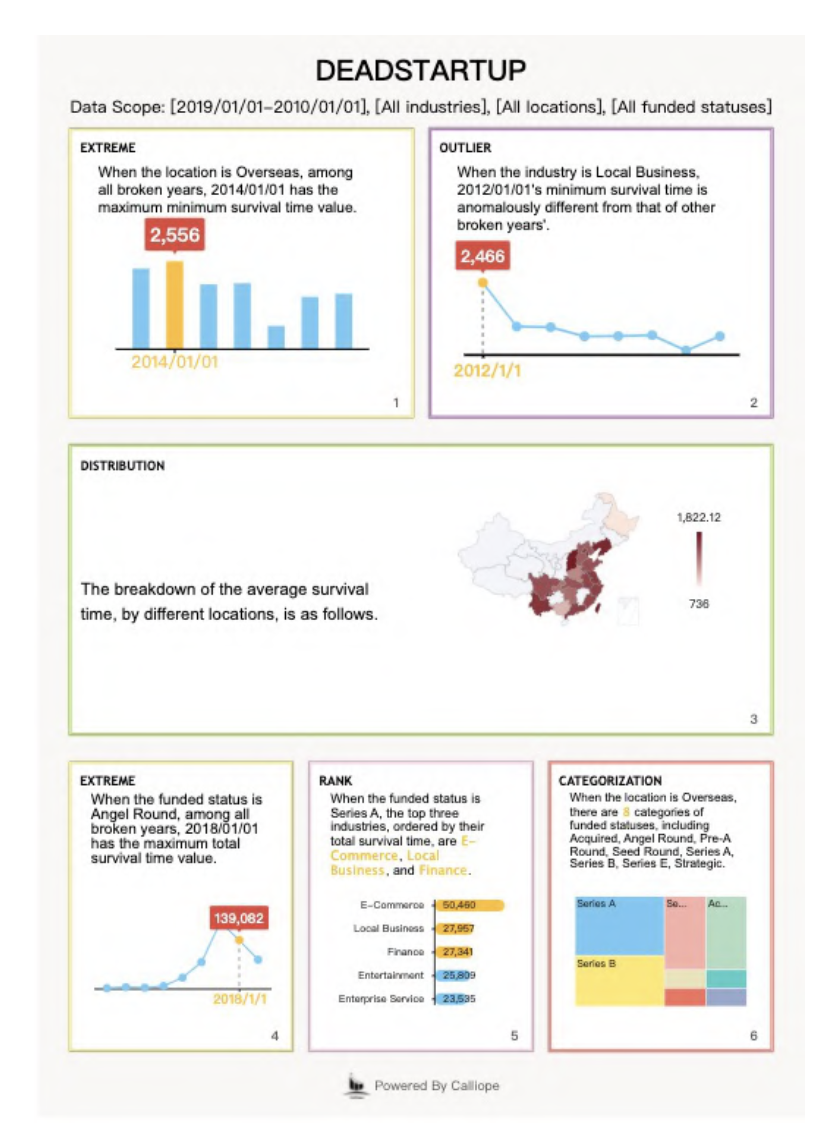
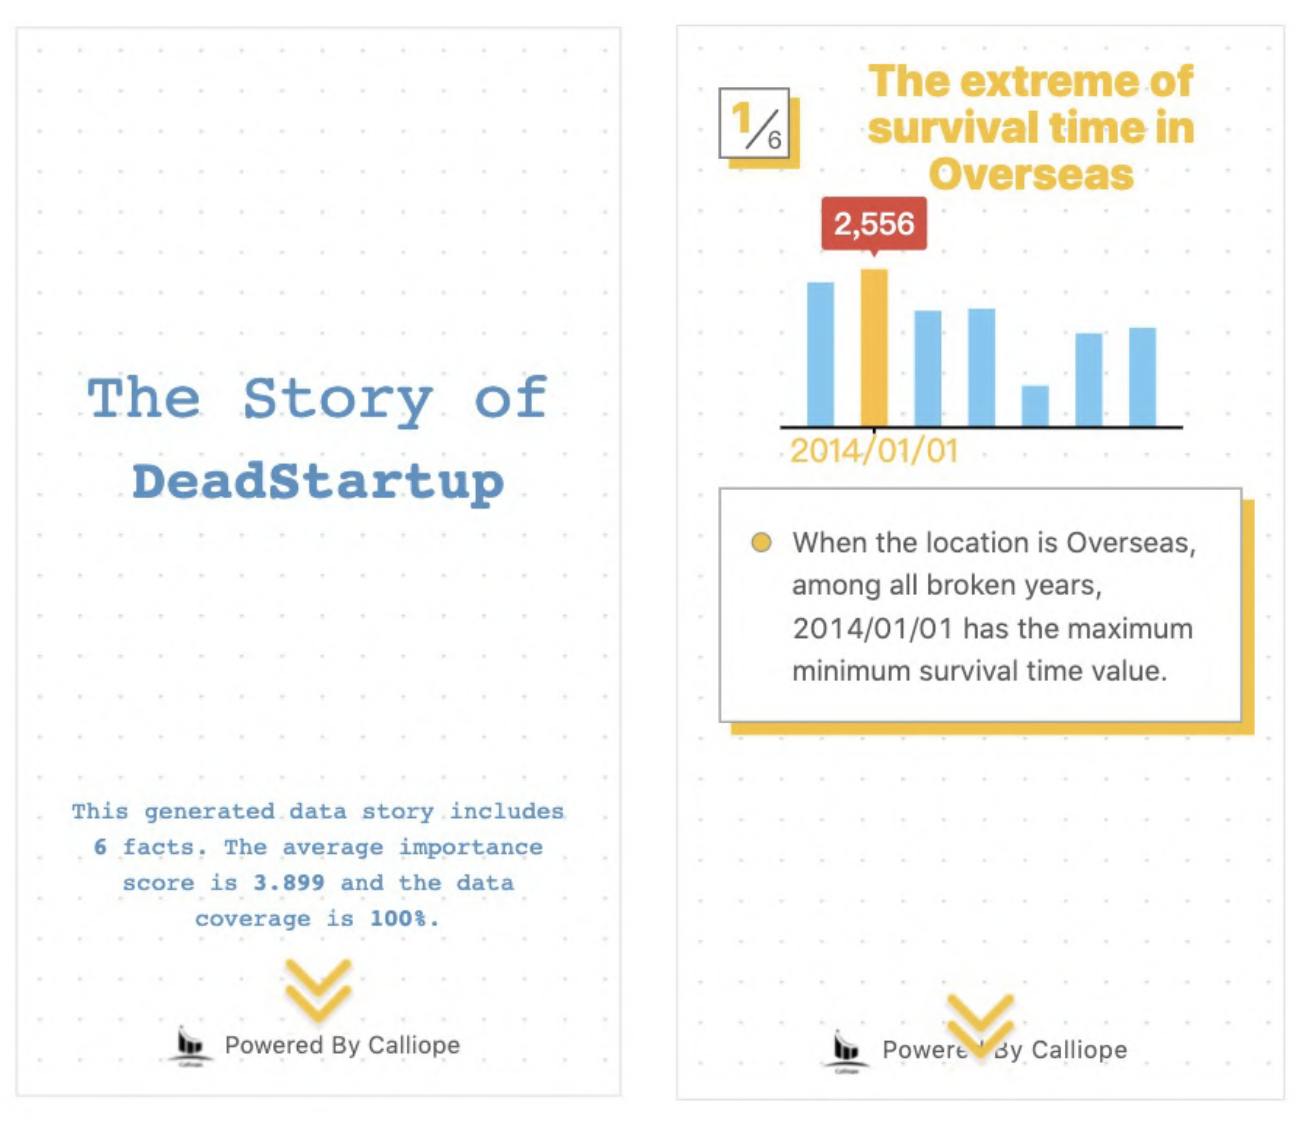
Factsheet mode displays data stories in a poster-like form, which is print-friendly.
![]()
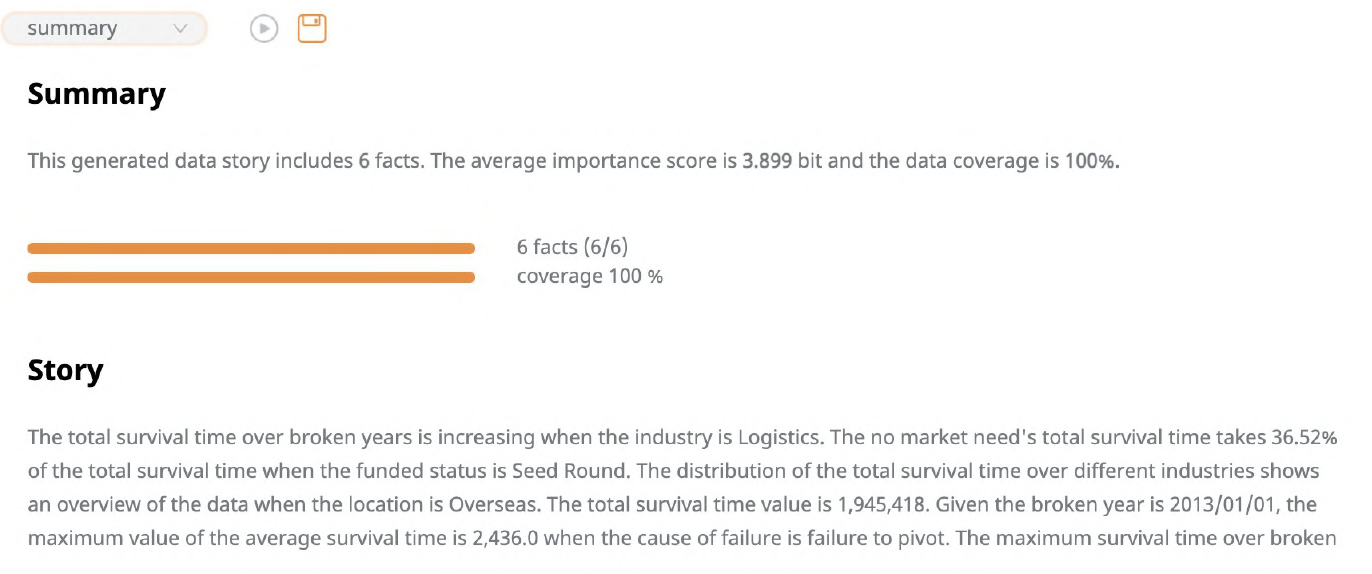
Summary mode displays a summary description of the current data story, including data coverage, the number of data facts, and a textual summarization of the story.
![]()
Mobile mode makes it convenient for users to browse the created data story by scrolling it down on mobile phones.
![]()
Data fact
Data fact is a five-tuple, including five fields of type, subspace, breakdown, measure, and focus, namely:
Data fact = {type,subspace,breakdown,measure,foucs}
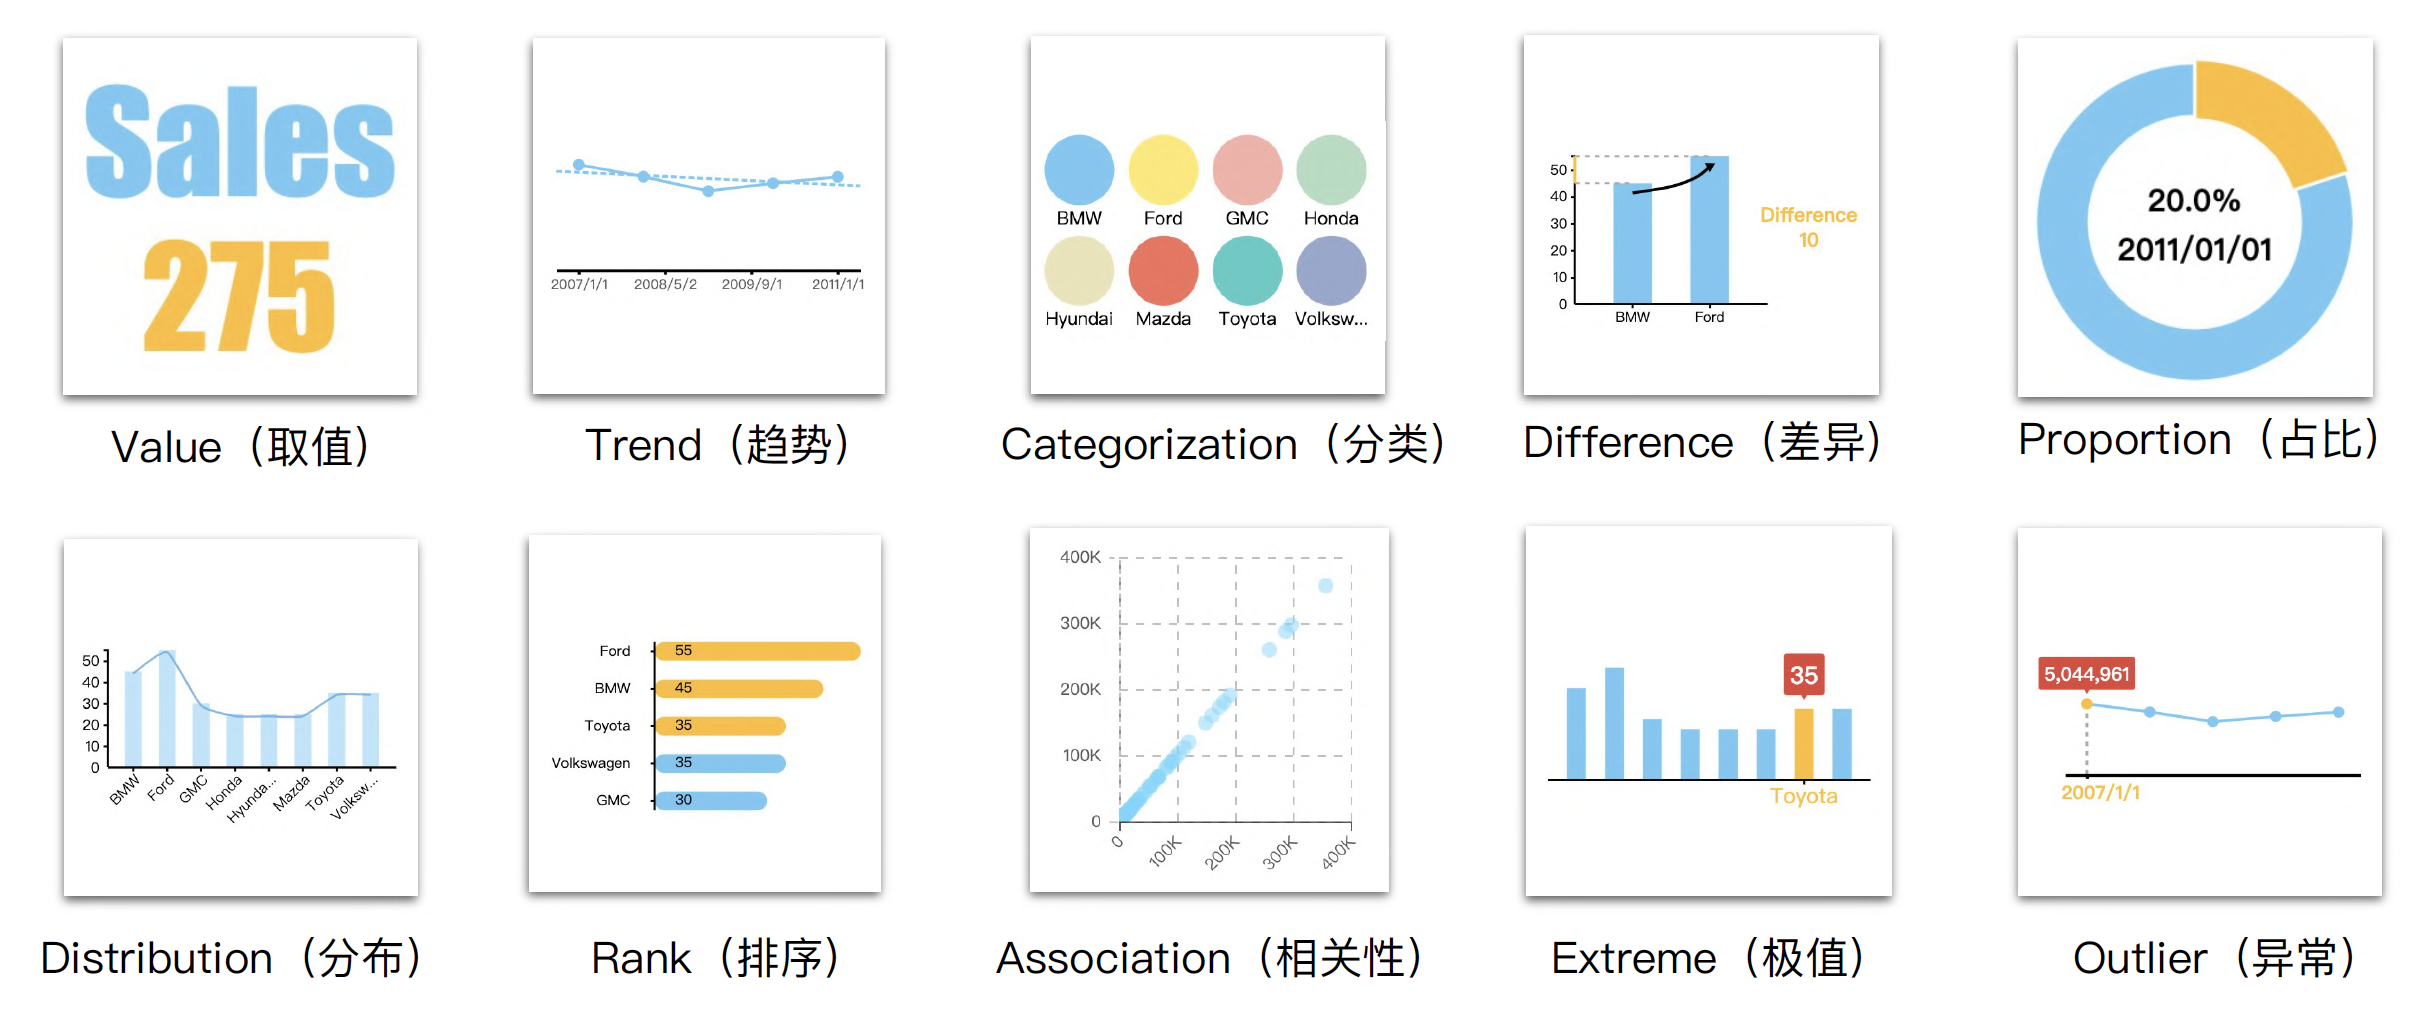
The type of data facts represents the type of information expressed by data facts. Calliope supports the following ten different common fact types.
Data fact is a five-tuple, including five fields of type, subspace, breakdown, measure, and focus, namely:
Data fact = {type,subspace,breakdown,measure,foucs}
The type of data facts represents the type of information expressed by data facts. Calliope supports the following ten different common fact types.
UIUX Design
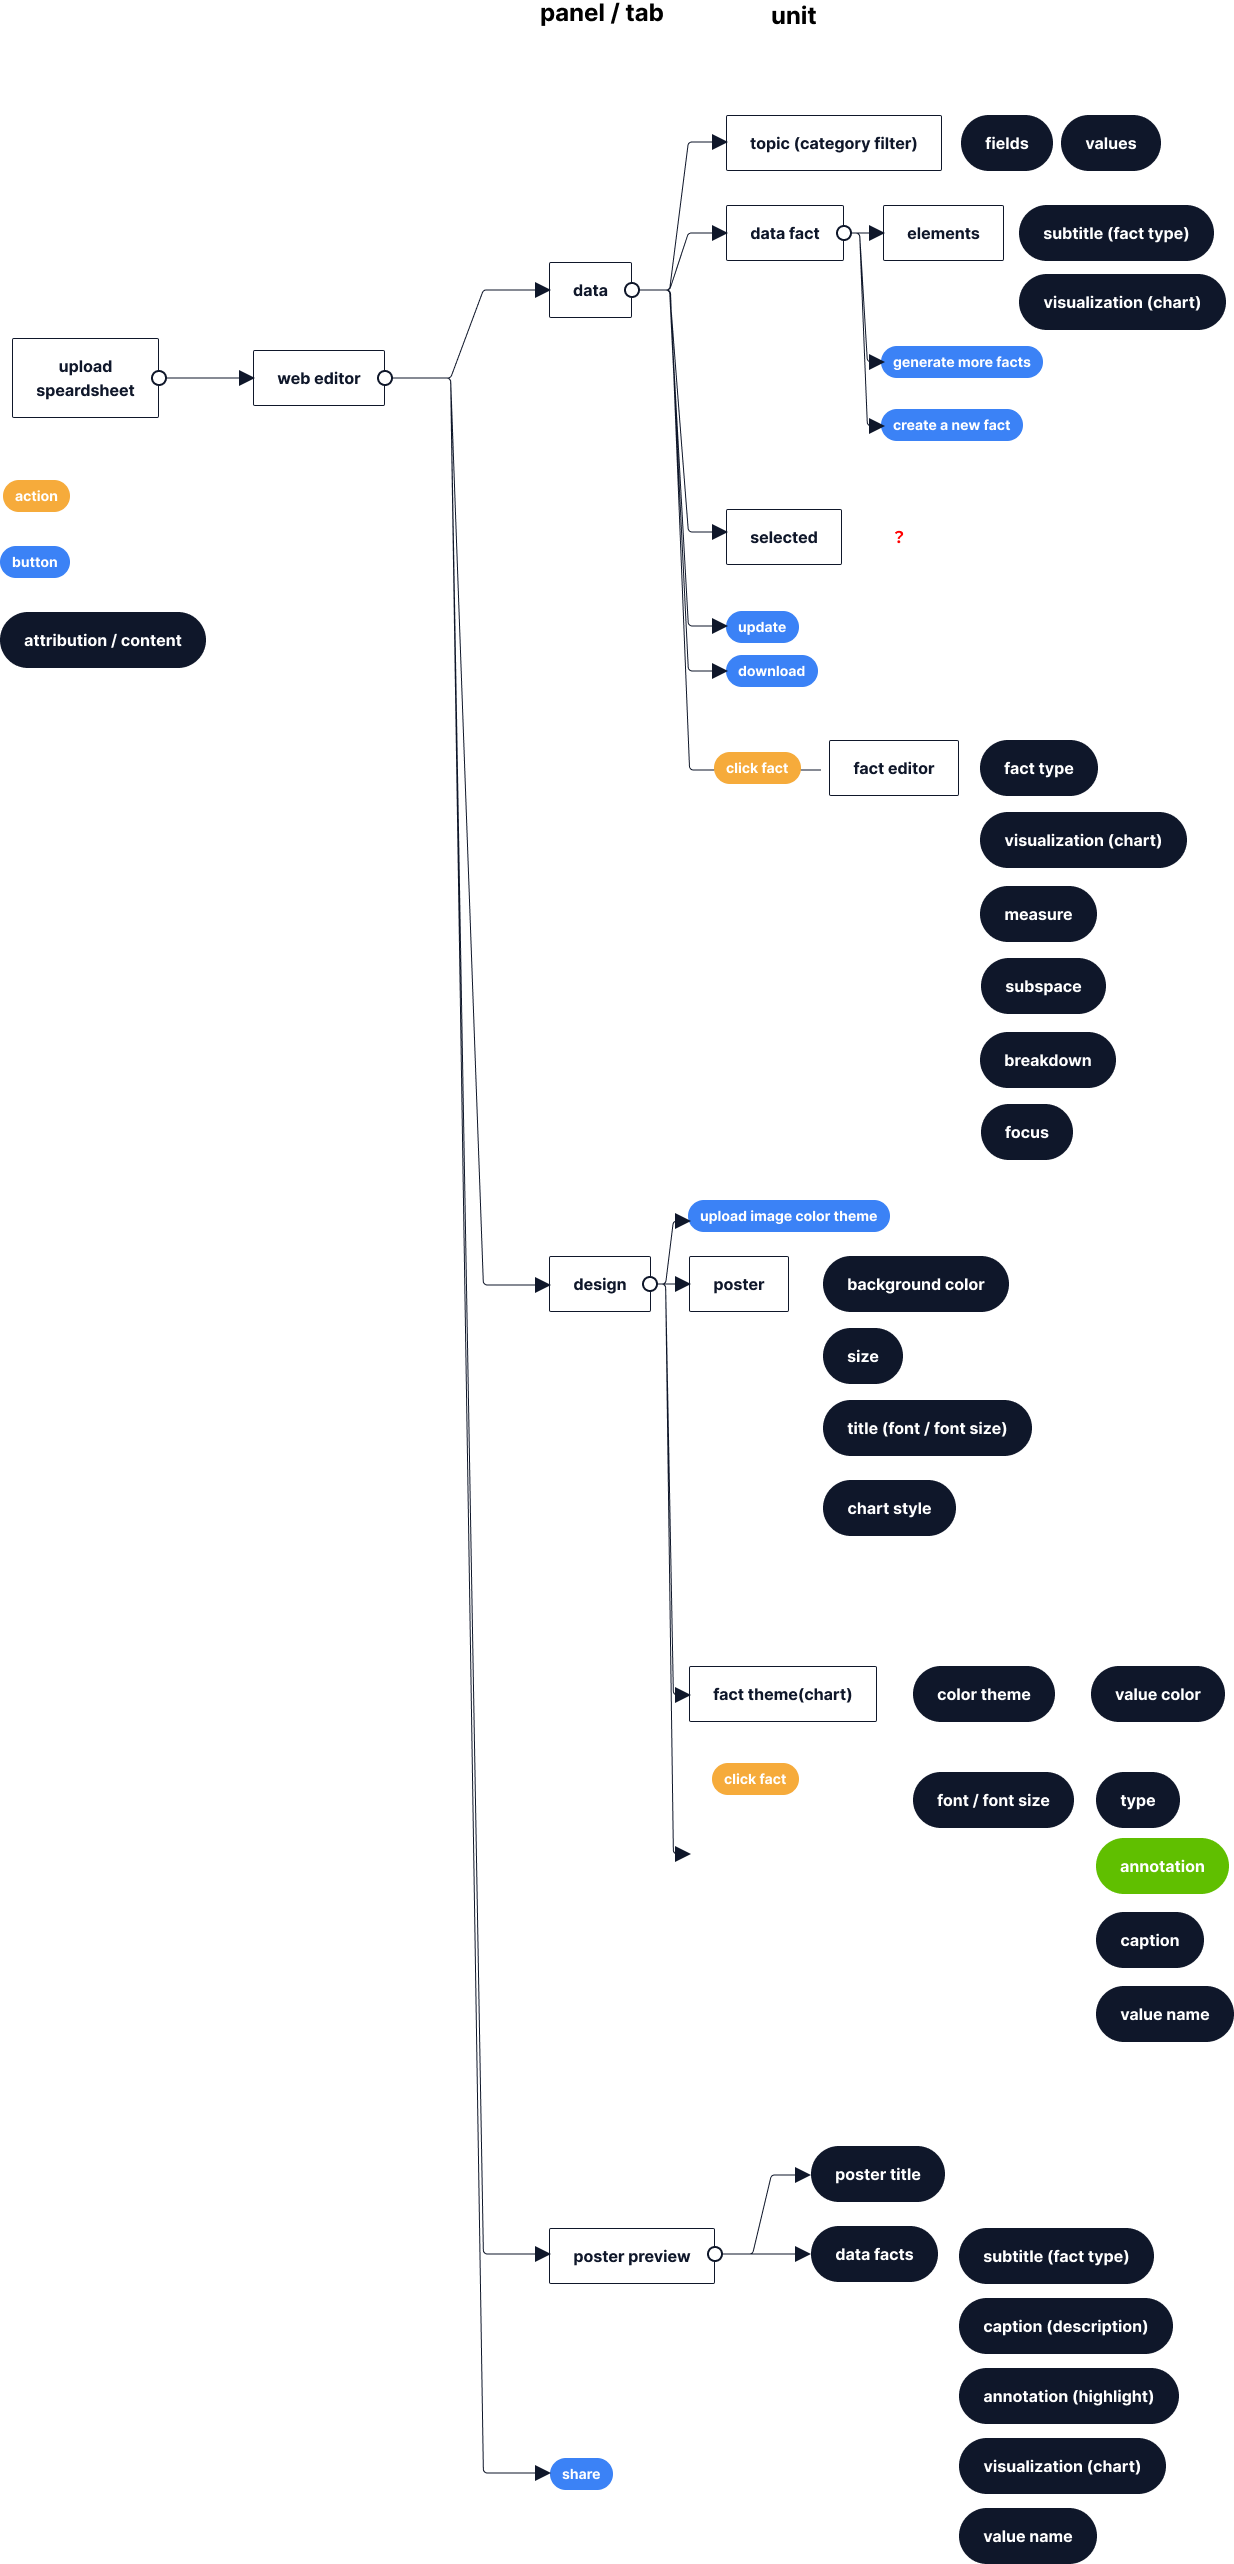
Infomation Architecture
Data Story Edit
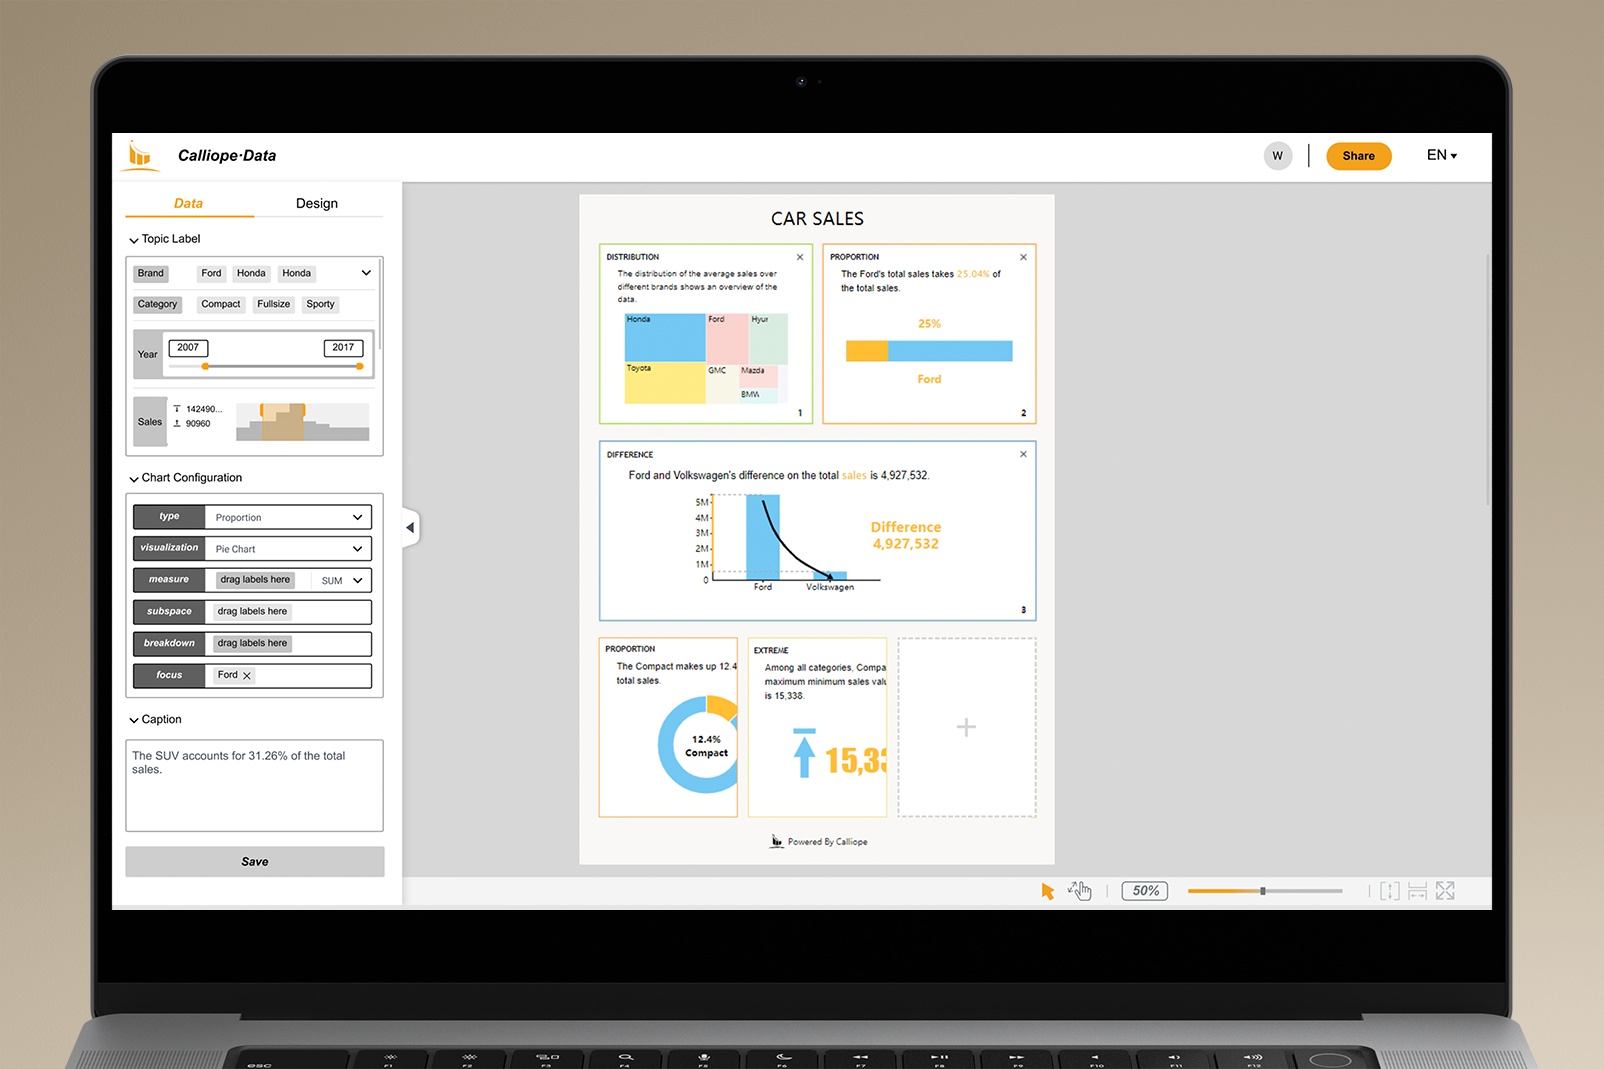
Main page
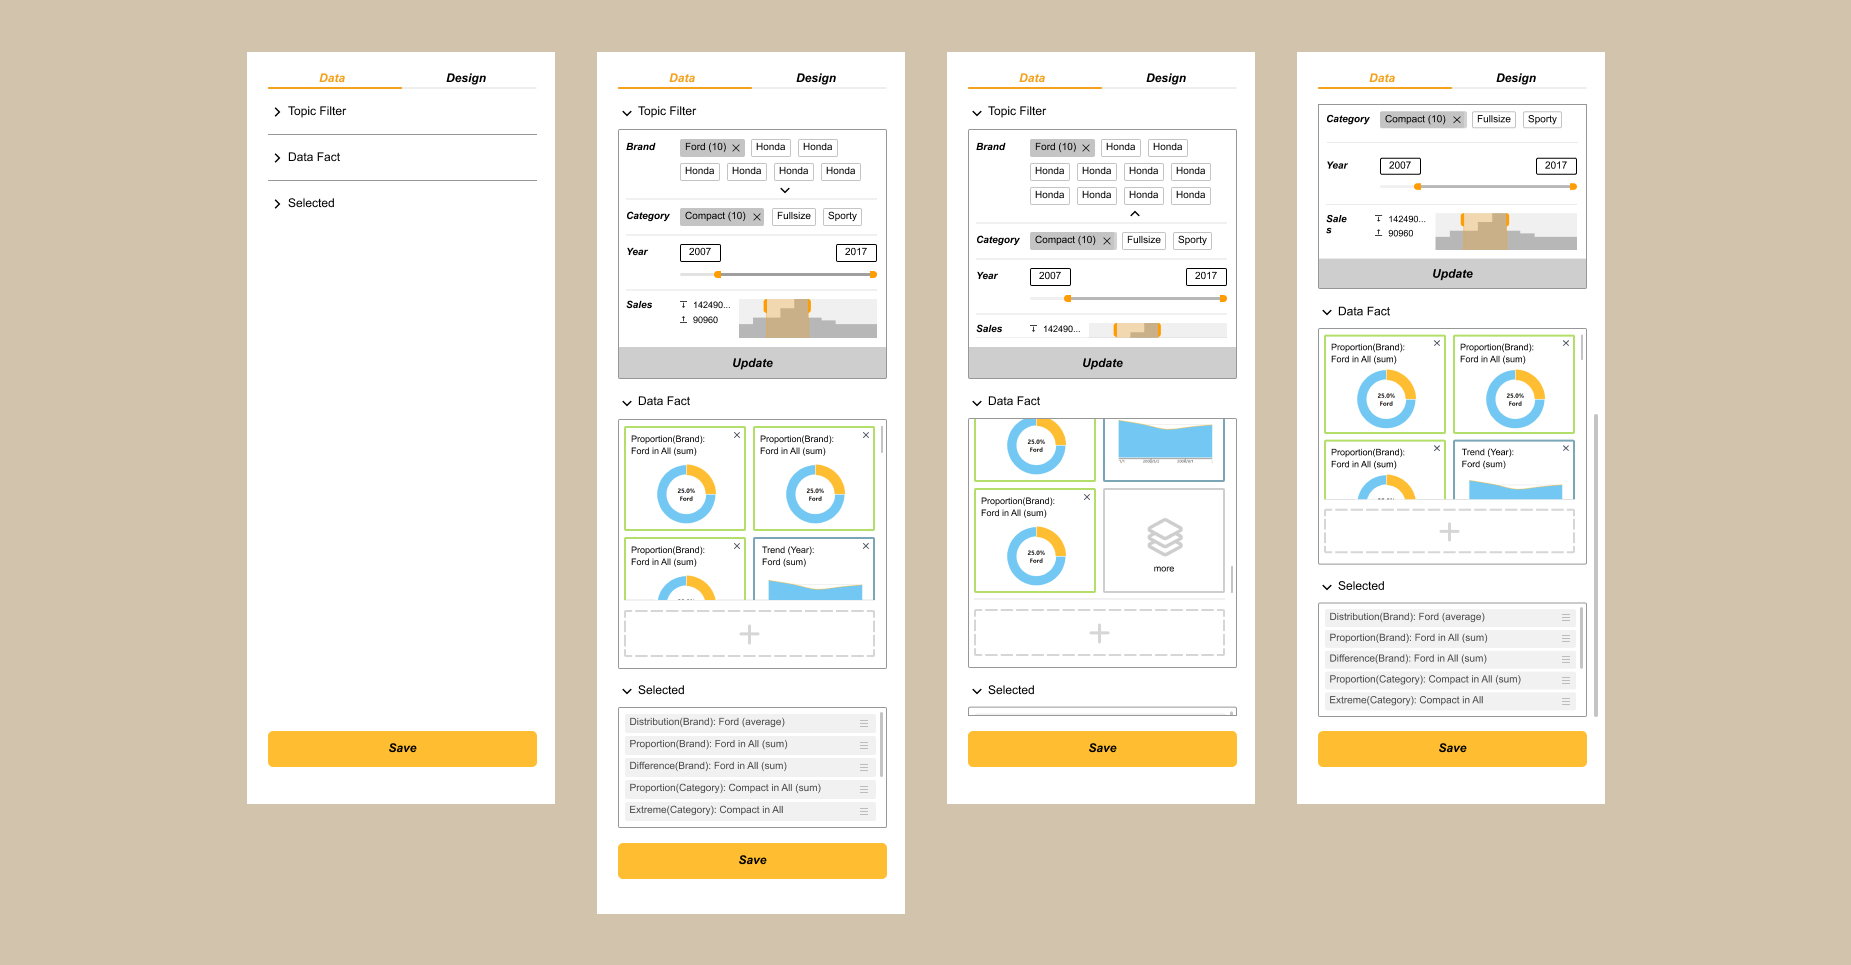
Edit panel
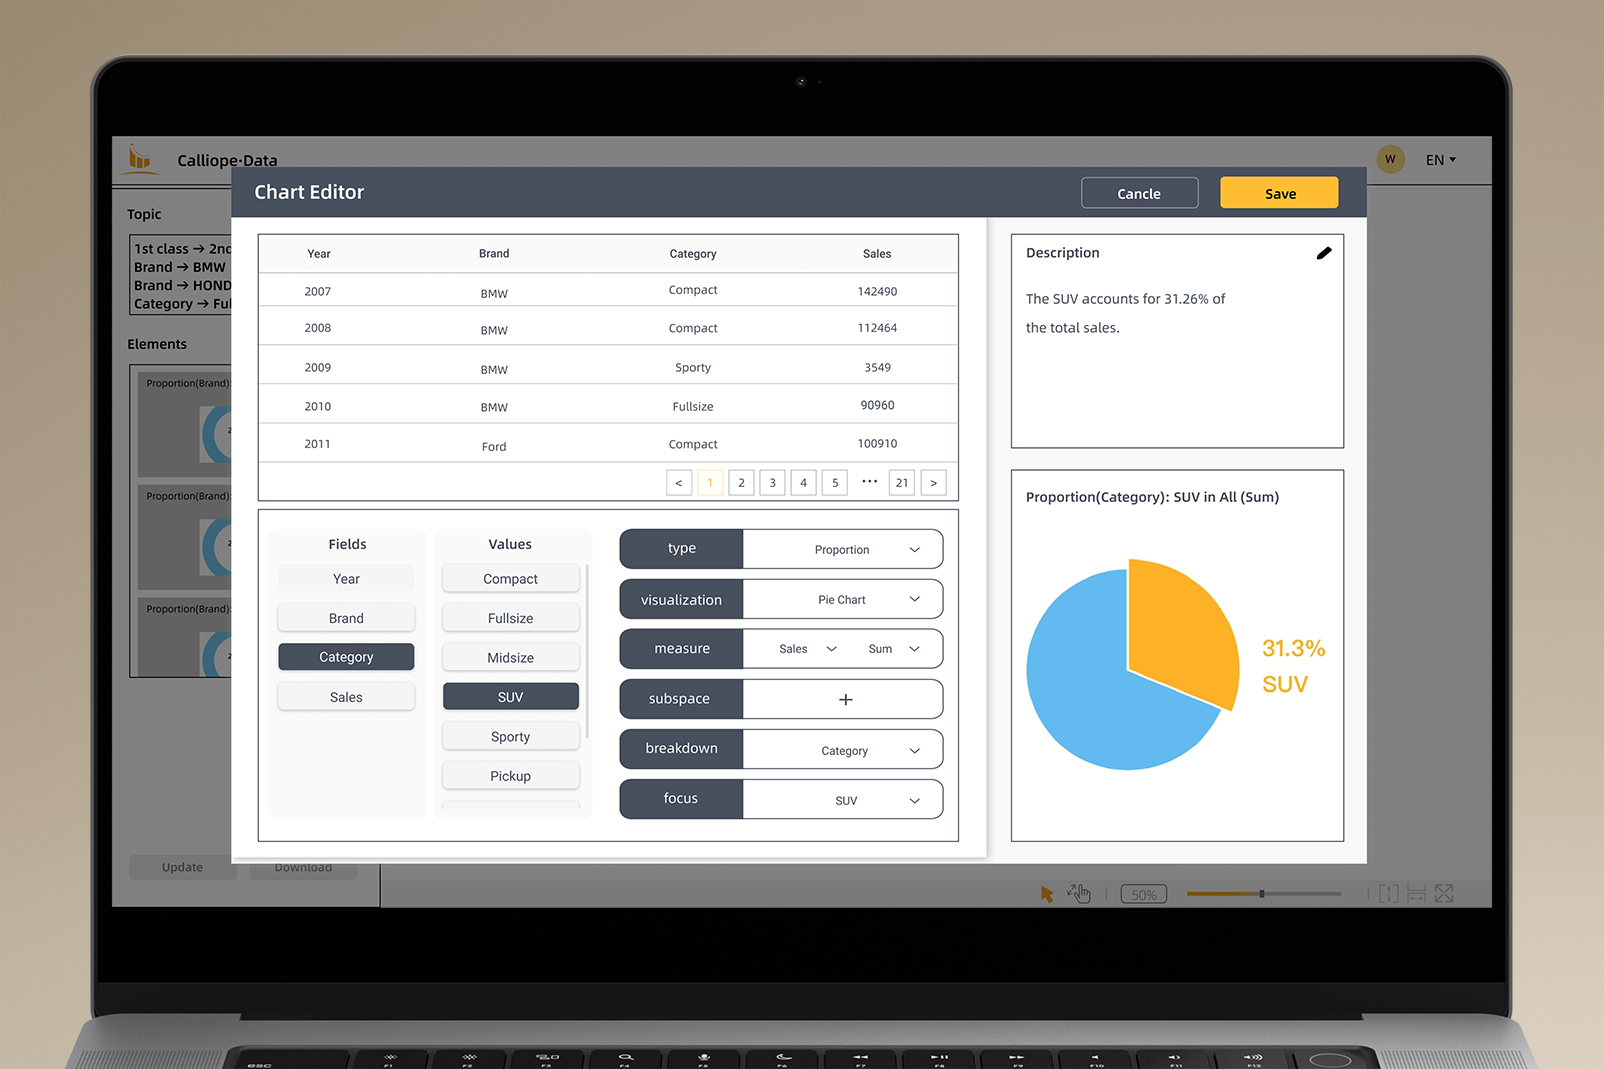
Chart edit
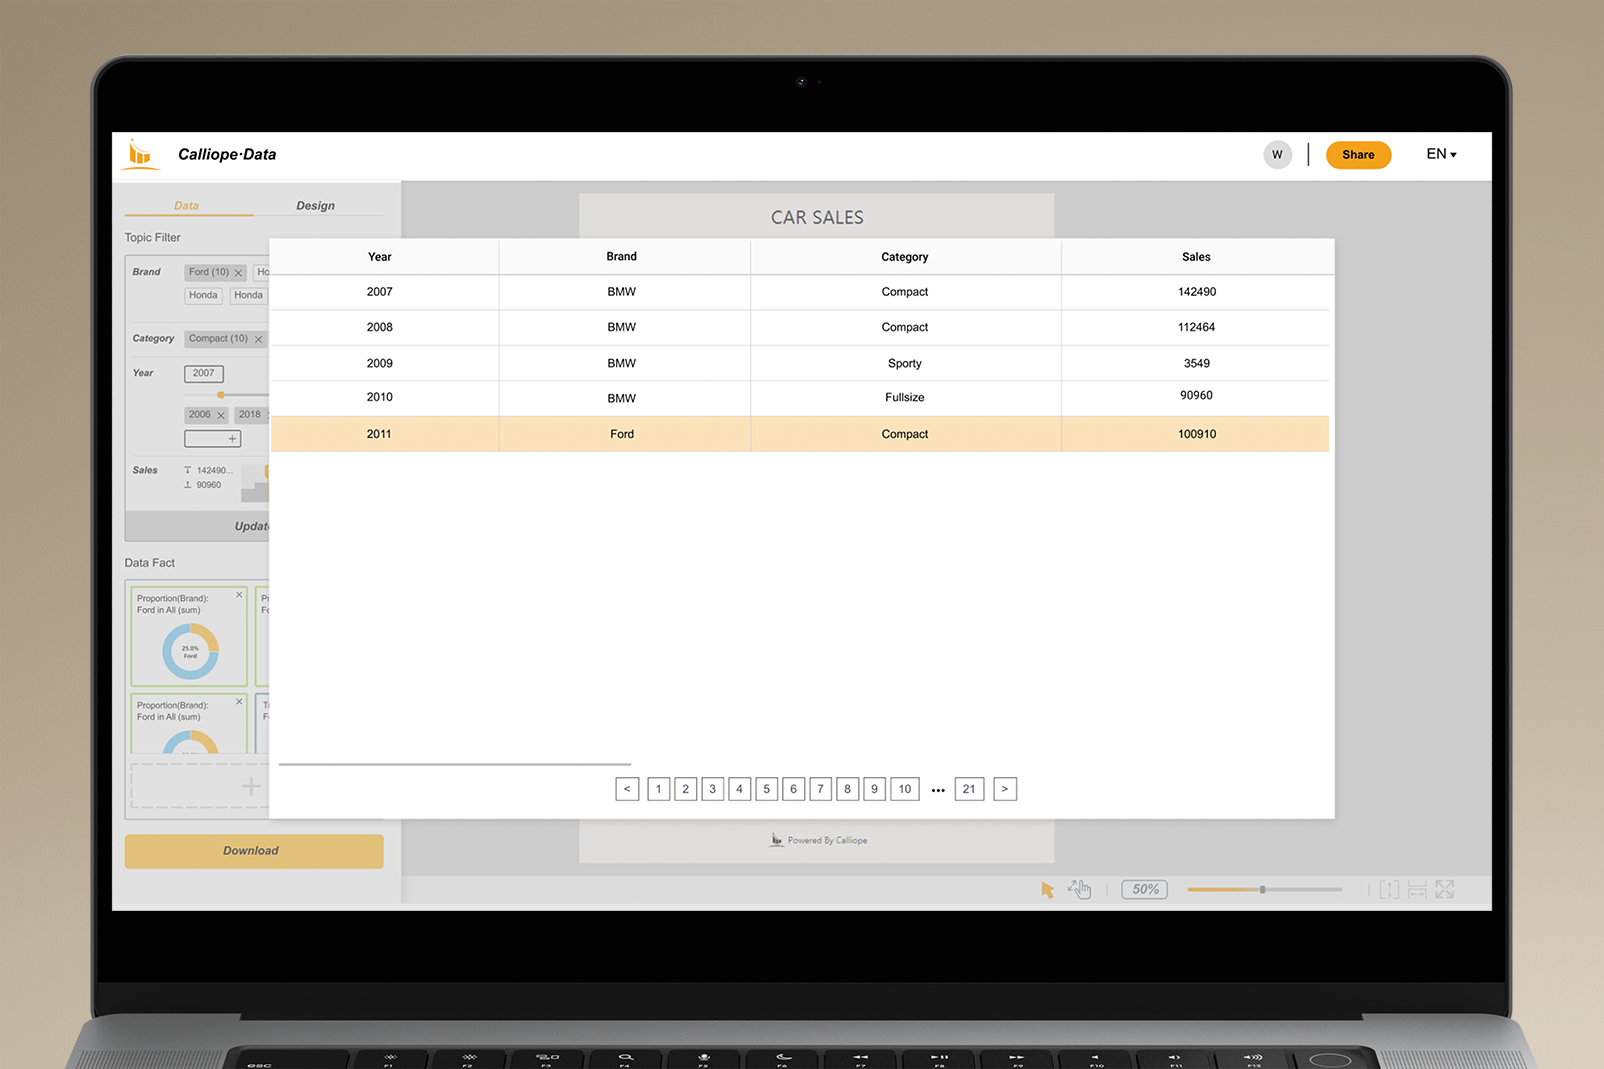
Spreadsheet
Data Fact Edit
Data fact edit page
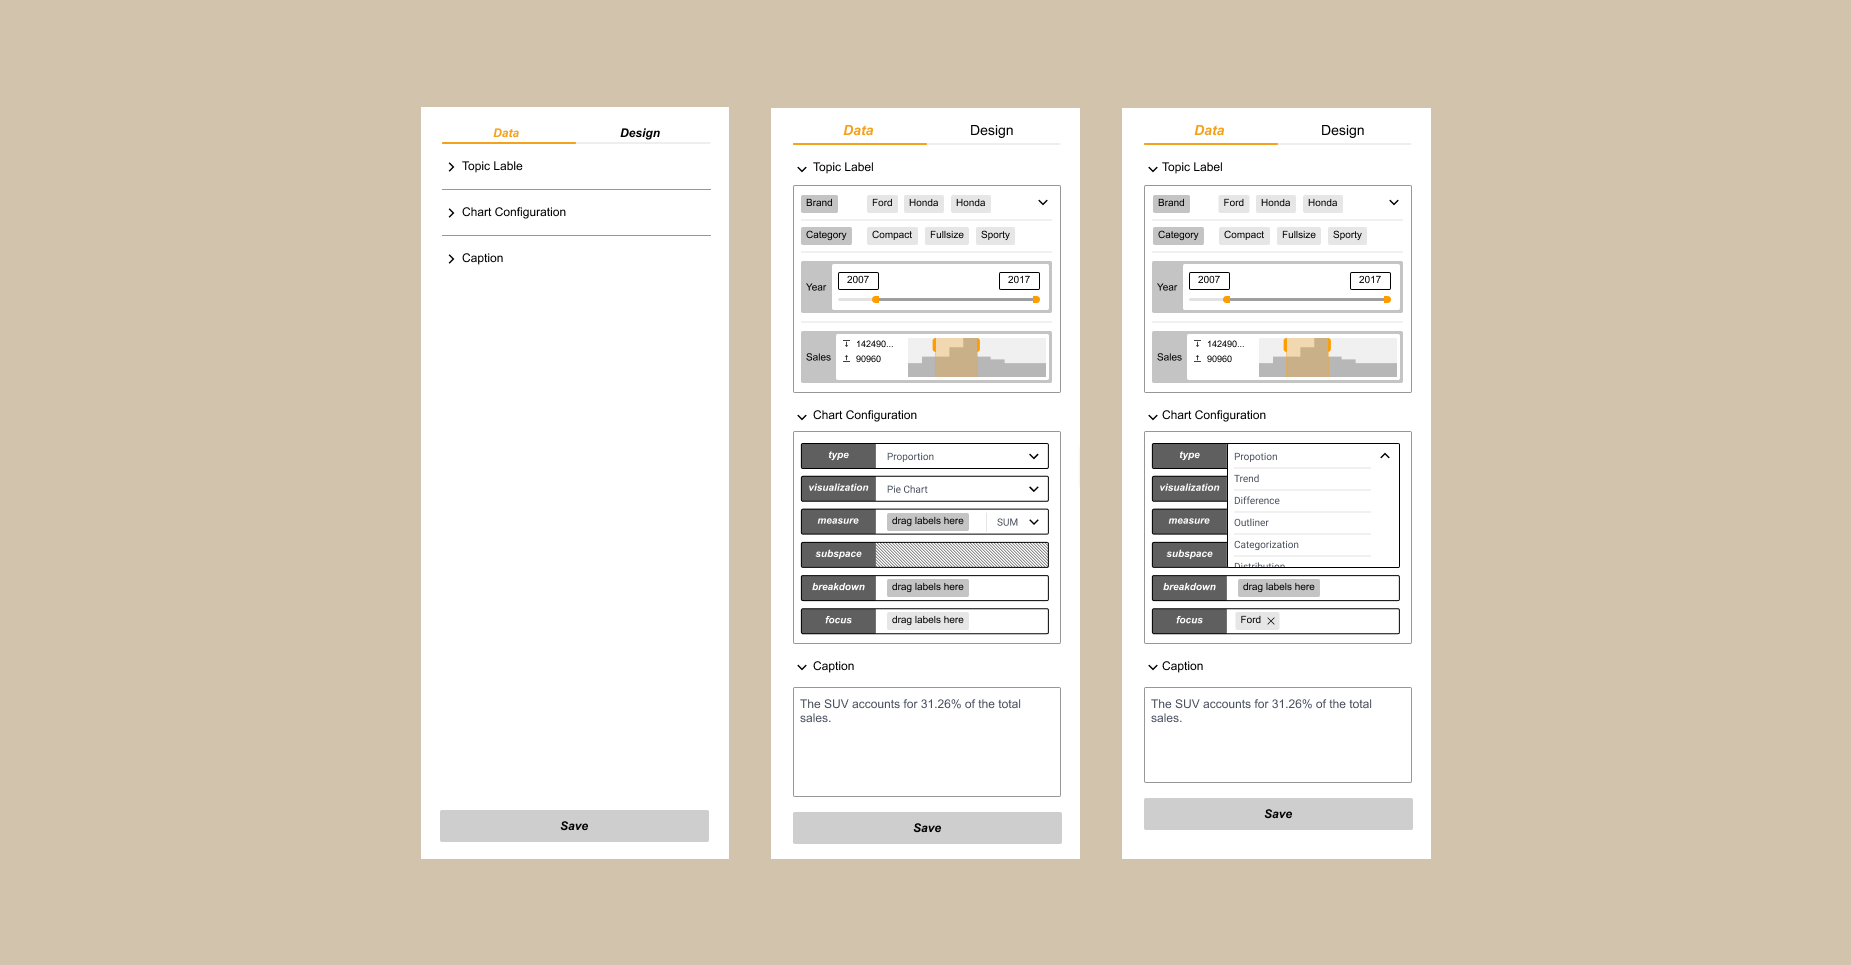
Data fact edit panel
Chart Style
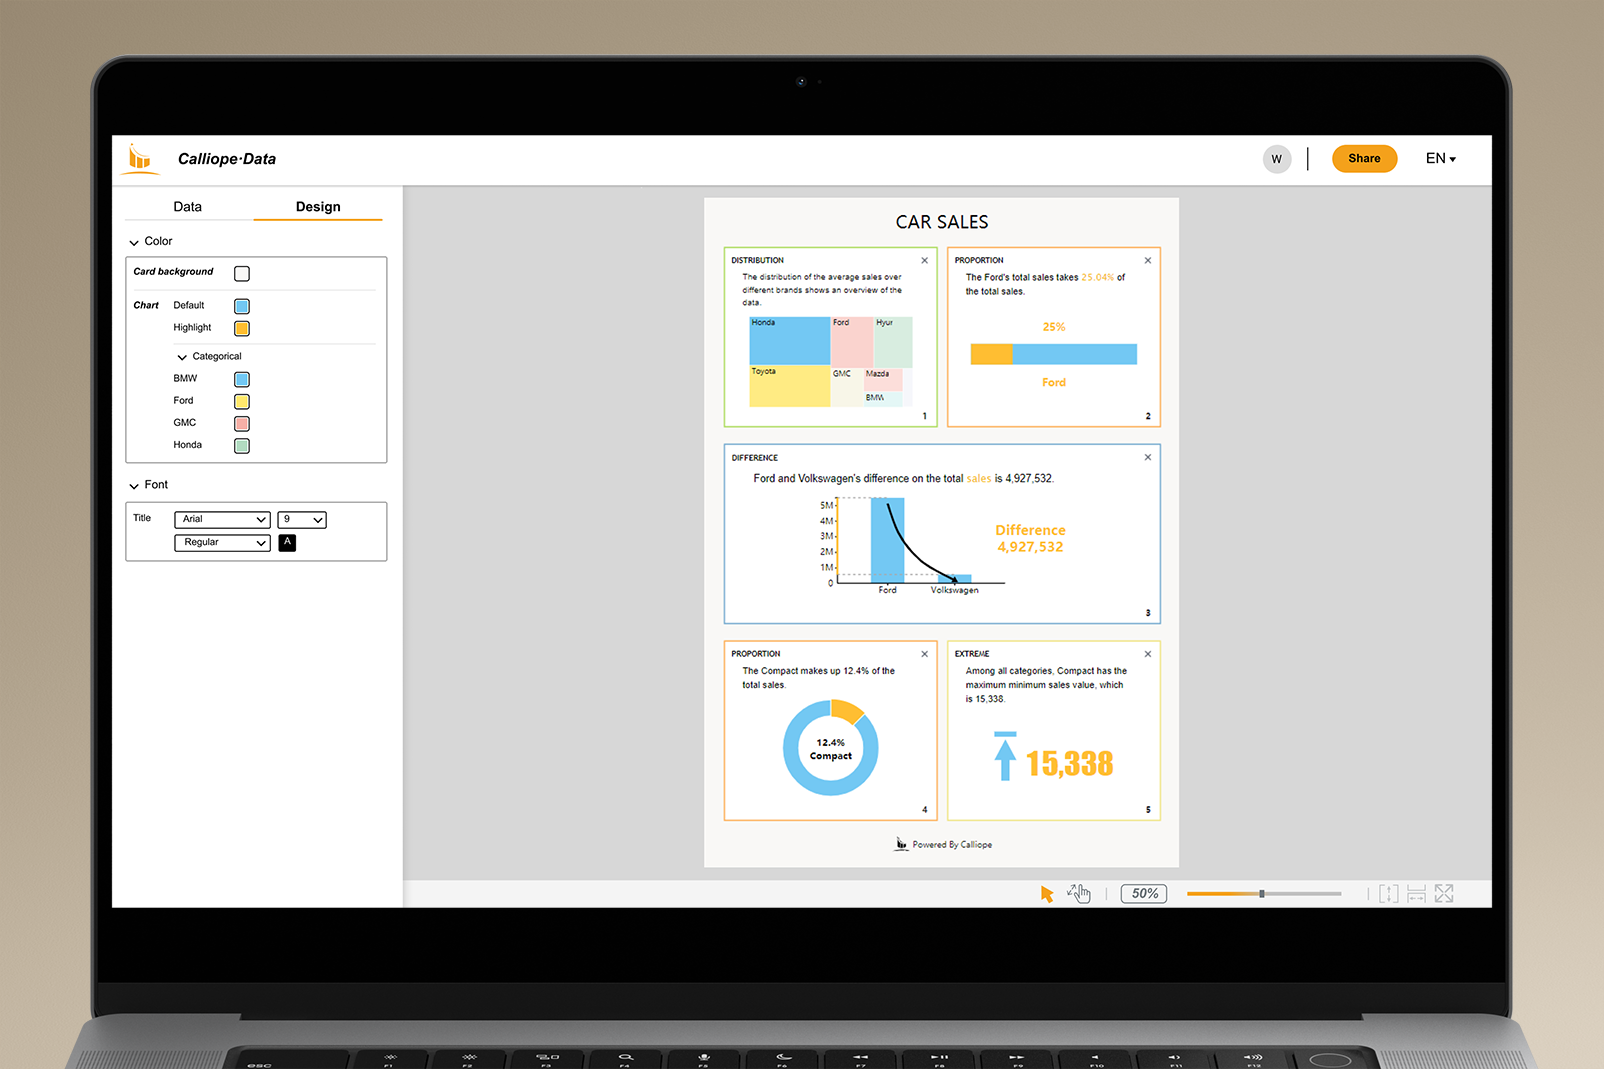
Chart style edit page 1
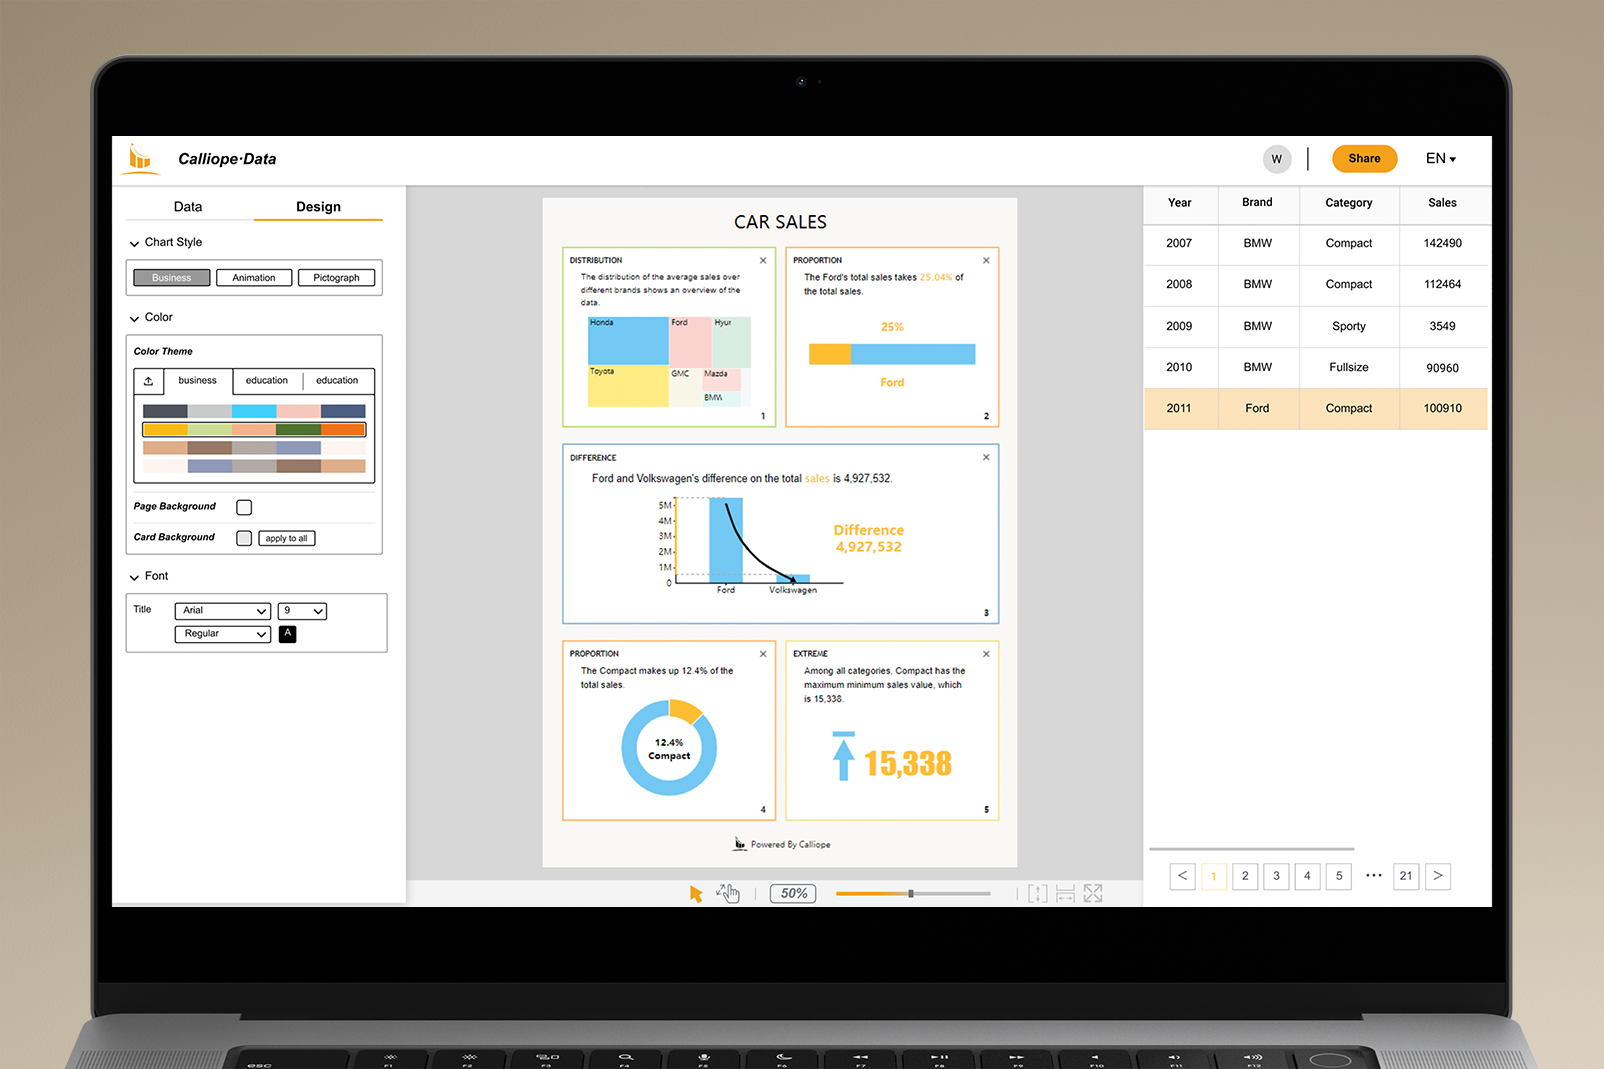
Chart style edit page 2
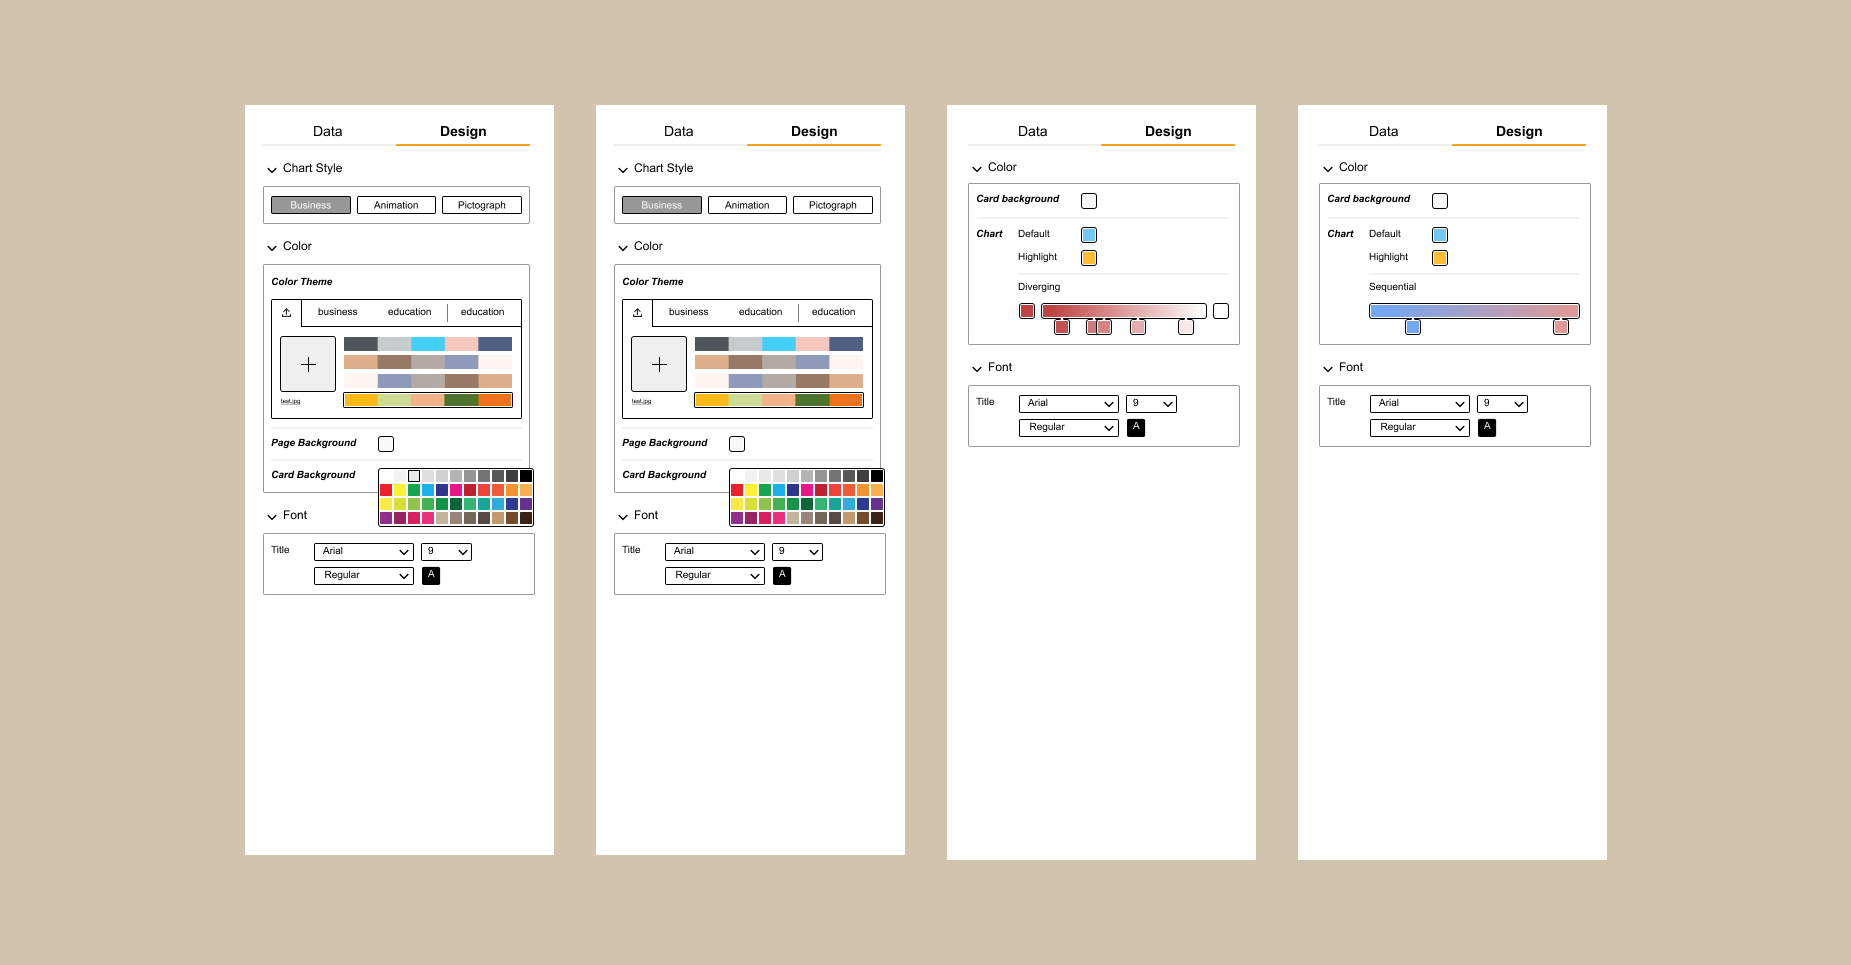
Chart style edit panel