Look Back Through Fog
Data Driven Design
Team
Yuan Zhang, Concept, Design, DevelopmentJiancheng Song, AI Scientist
Data Driven Design
Team
Yuan Zhang, Concept, Design, DevelopmentJiancheng Song, AI Scientist
Look Back Through Fog is a web-based data sculpture project run by t-SNE machine learning algorithm and creative coding, aims to create an emotional data experience and mobilize an aesthetics of “blur” to display how we as the public get close to the truth of conflicts through fog of overwhelming information, fog of history, fog of war. This data-driven project narrates life and death at scale caused by conflicts in the past 30 years using the dataset called
UCDP (Uppsala Conflict Data Program). It builds a space to take the audiences to rethink and evoke discourses on the cost of conflicts in digital and physical forms.


The concept comes from a term, “Fog of War”, it was introduced by Carl von Clausewitz in his book, Vom Kriege (1832), which means “the uncertainty in situational awareness experienced by participants in military operations”. I want to give the audience a similar feeling of “Fog” to experience the difficulity to get to the truth through the fog of history, information, and concepts.
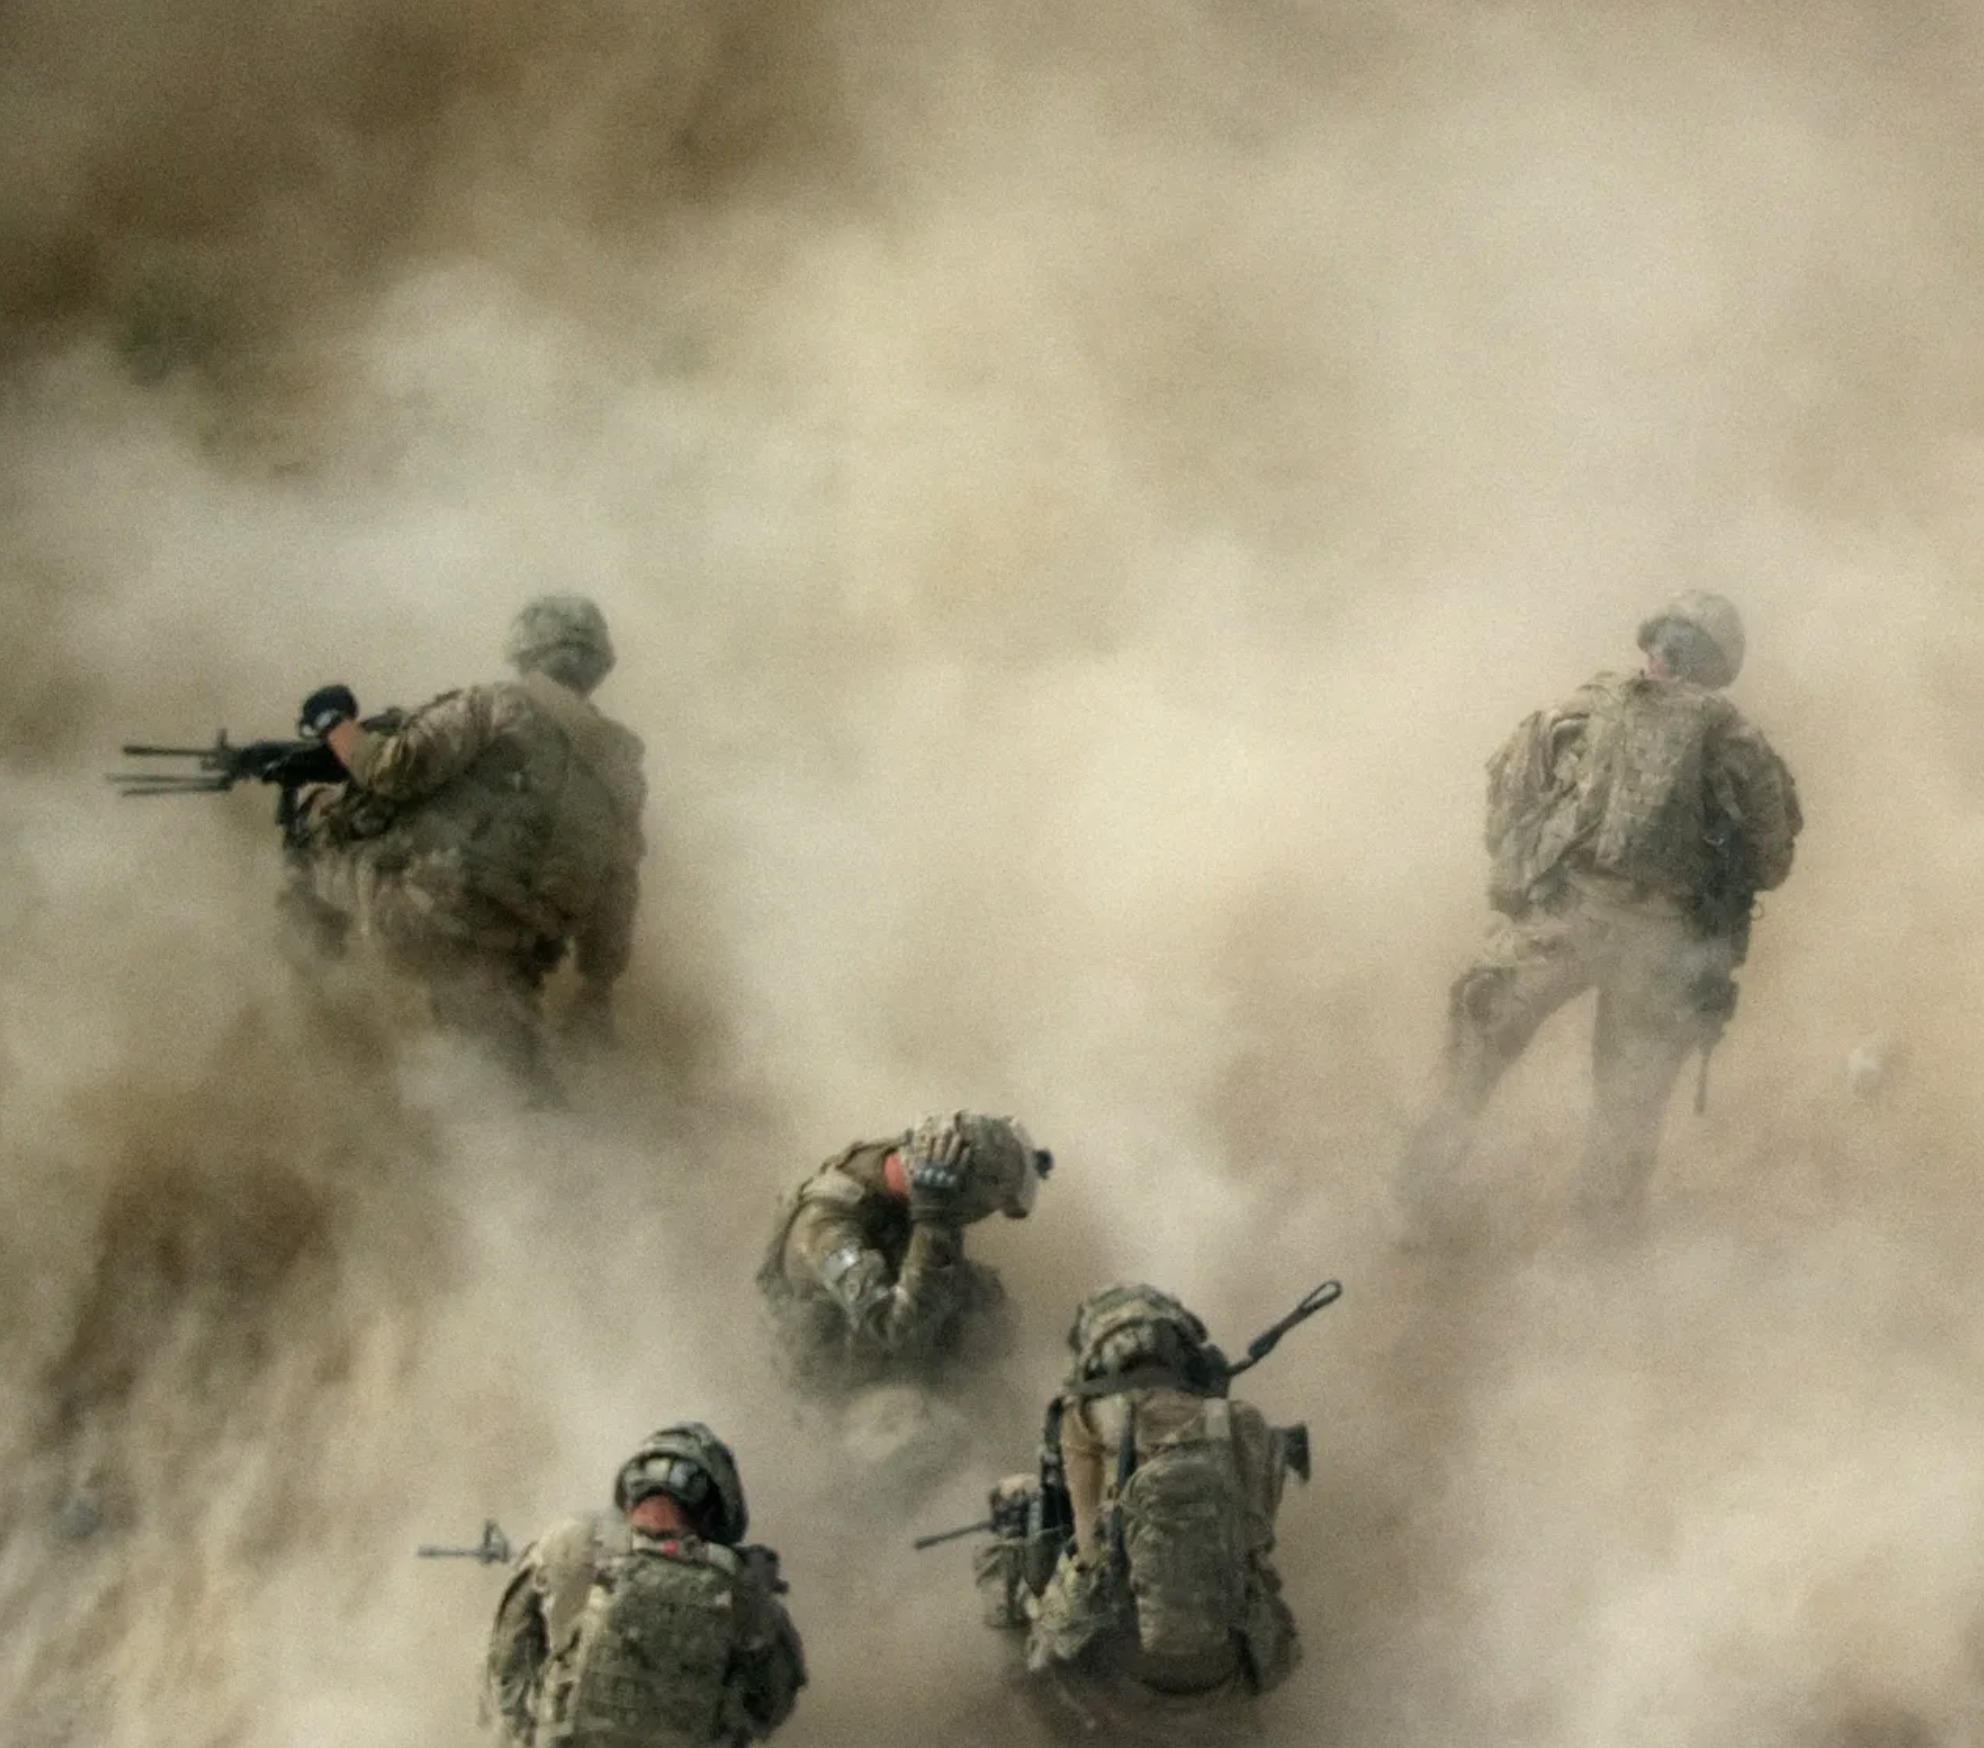 Photograph by Johannes Eisele / AFP / Getty
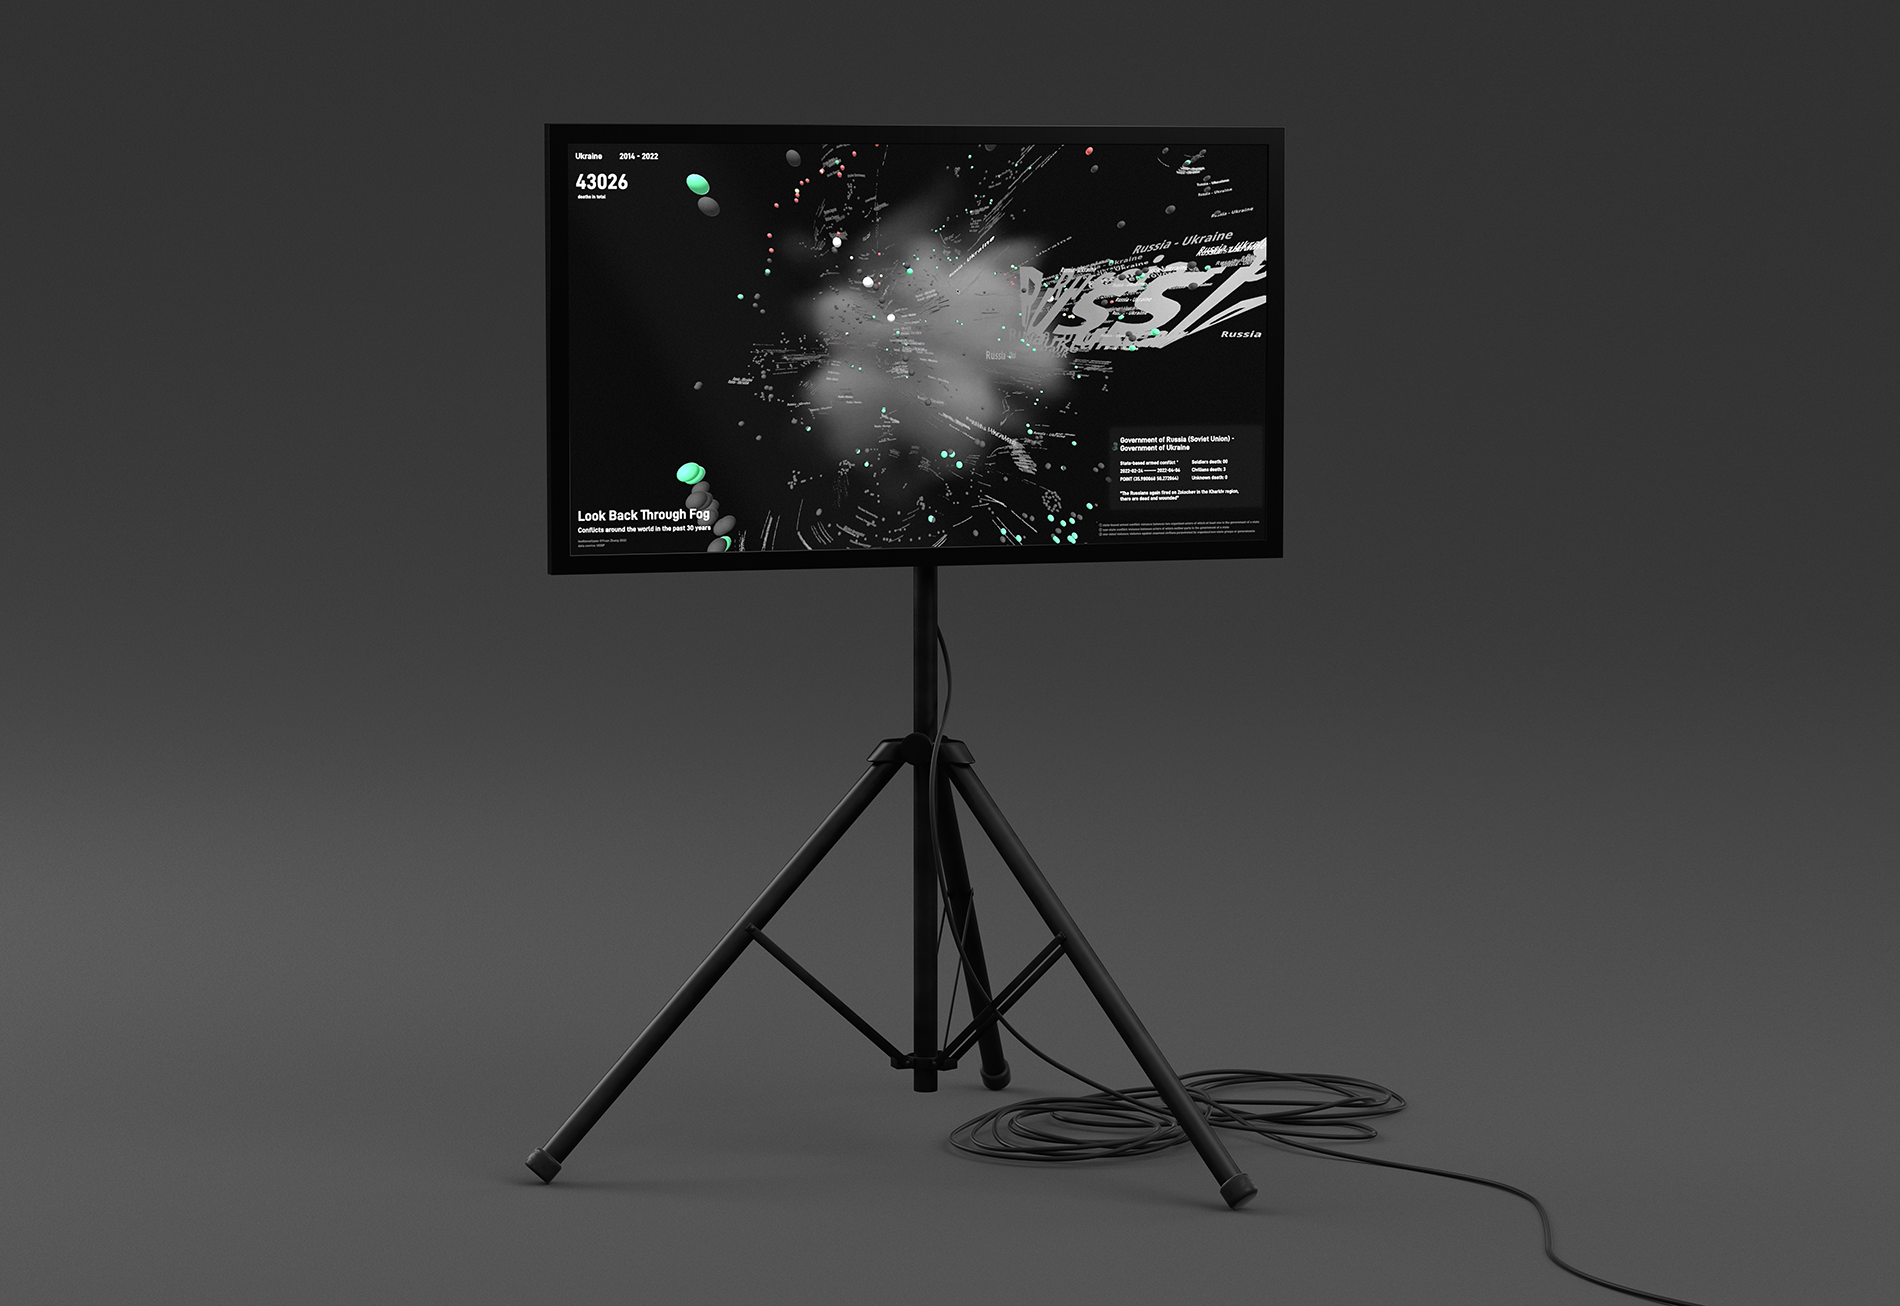
The sculpture is displayed on a standing screen, people could explore through the fog by using a touchpad.
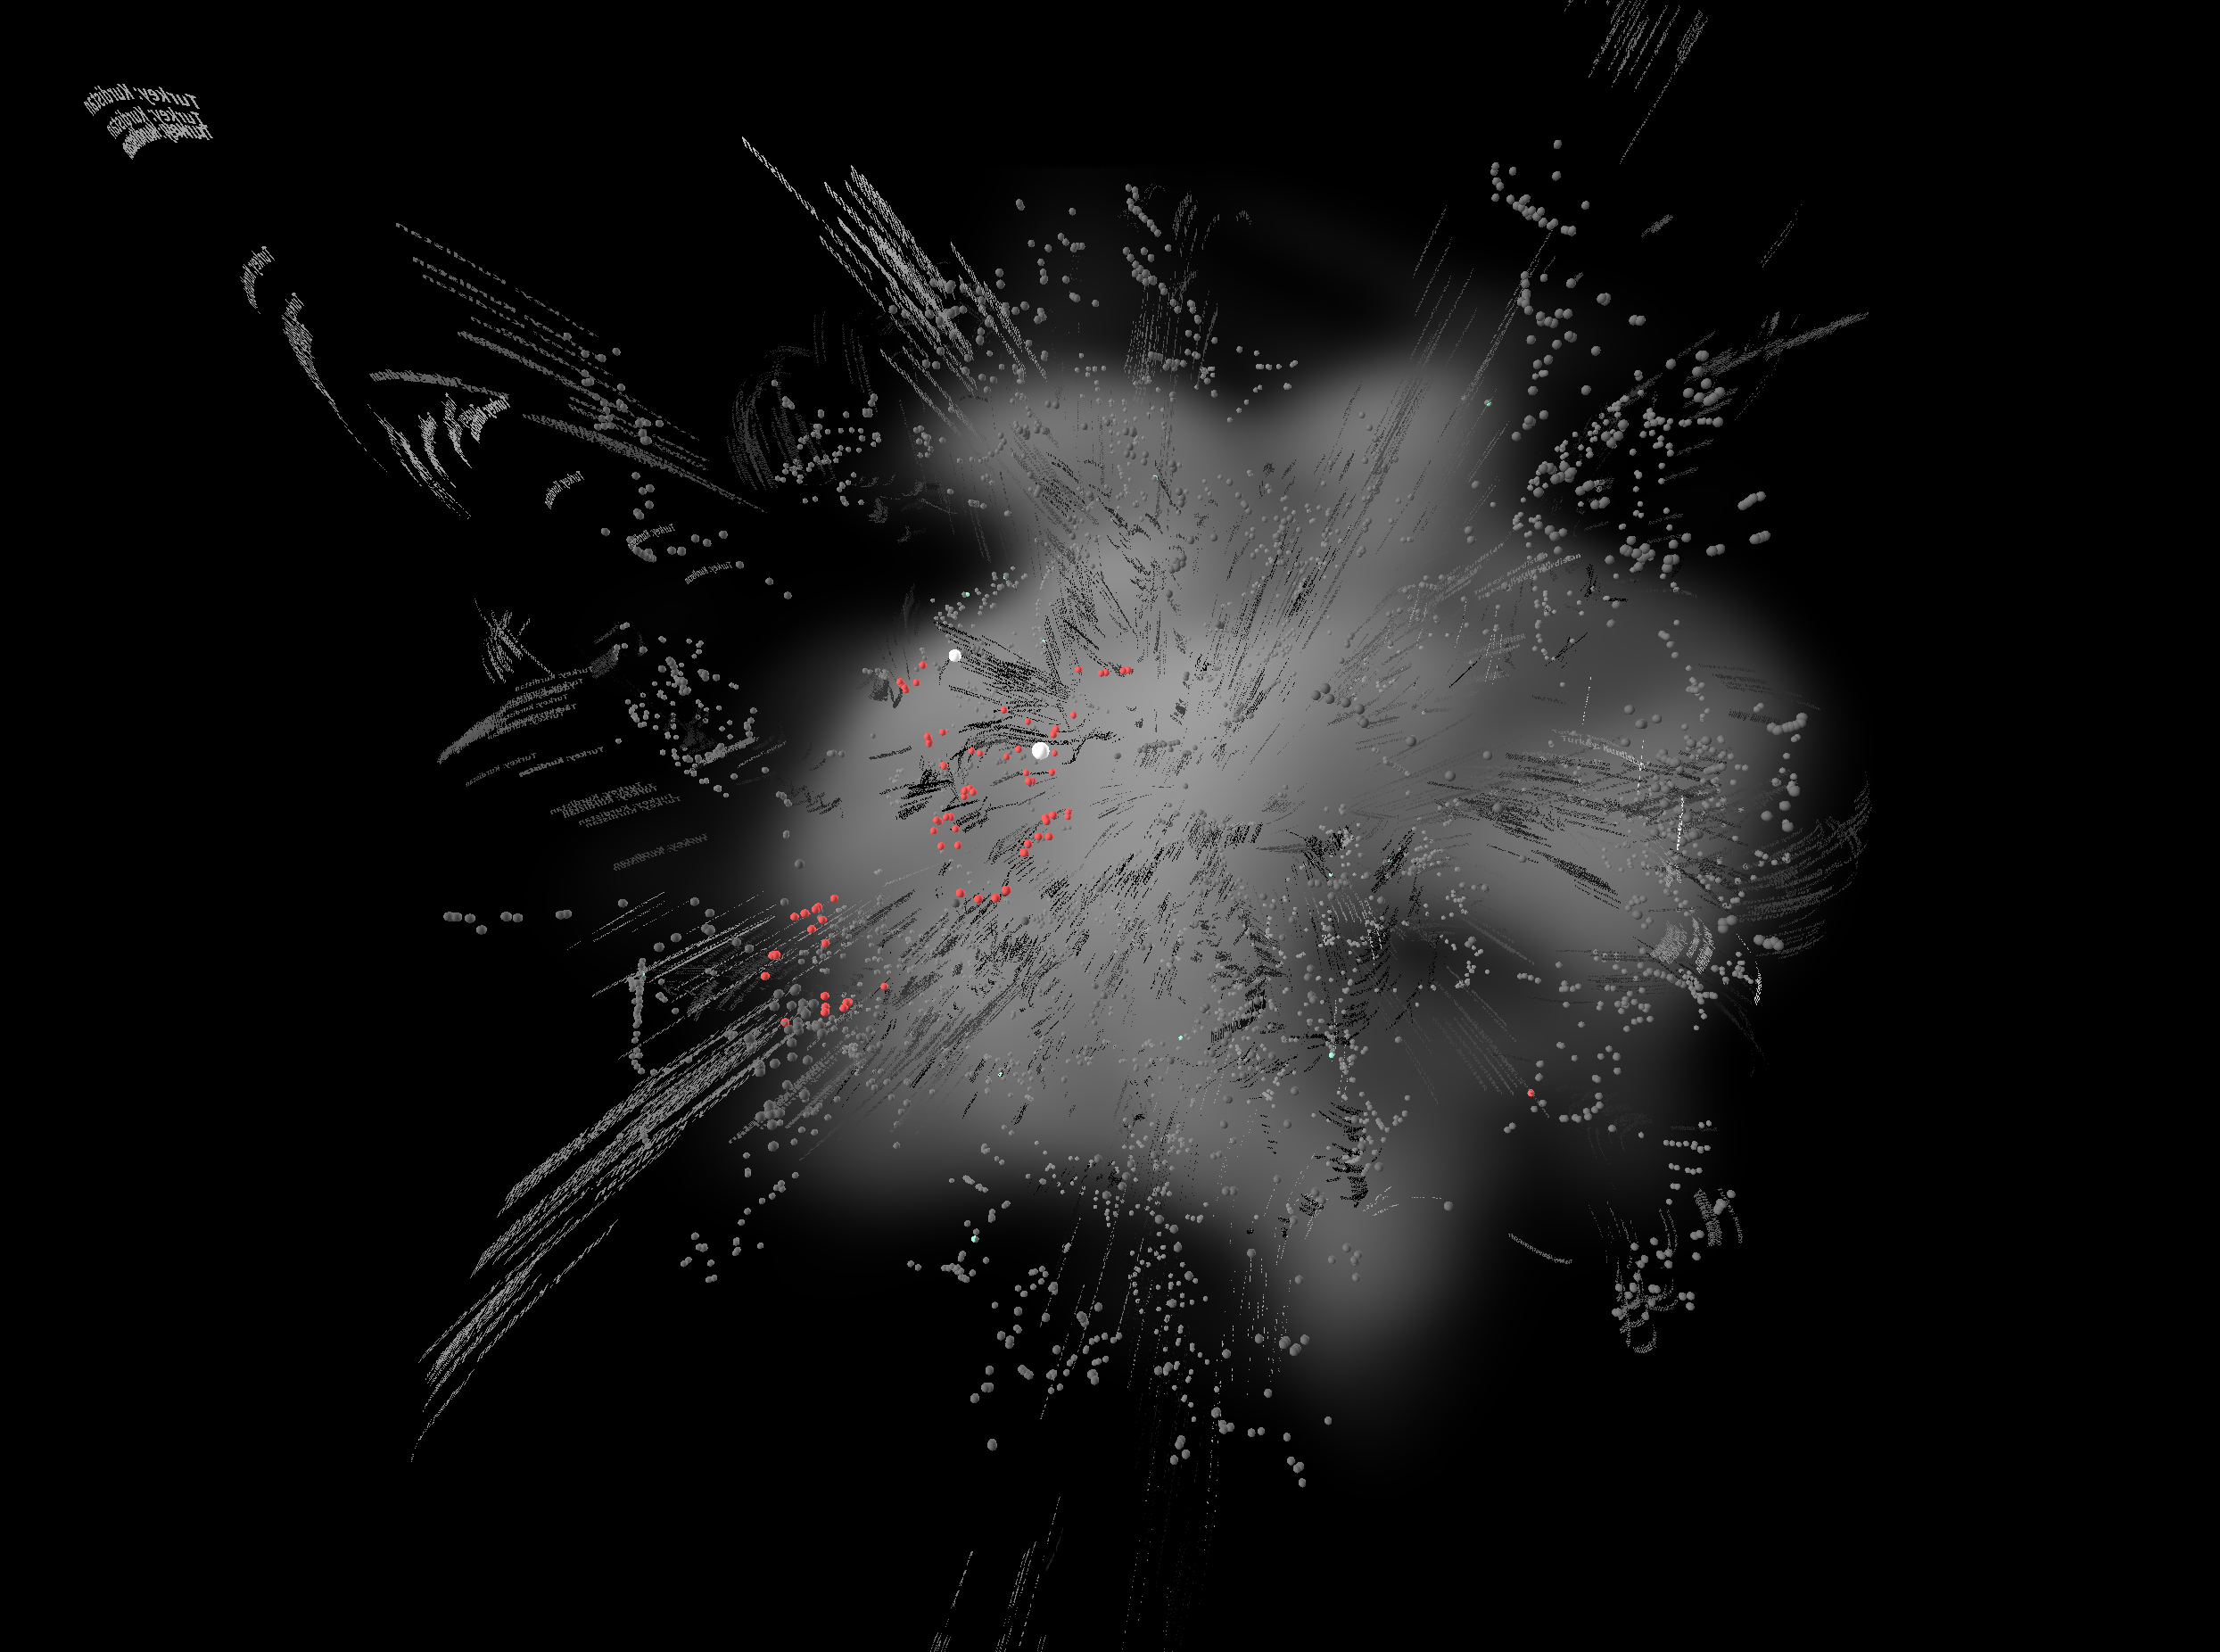
Each dot represent a conflict event. Each dot is followed by a text which is the war name of the conflict event.
And it is based online, so people could experience it on website.
Each dot represent a conflict event. Each dot is followed by a text which is the war name of the conflict event.
And it is based online, so people could experience it on website.

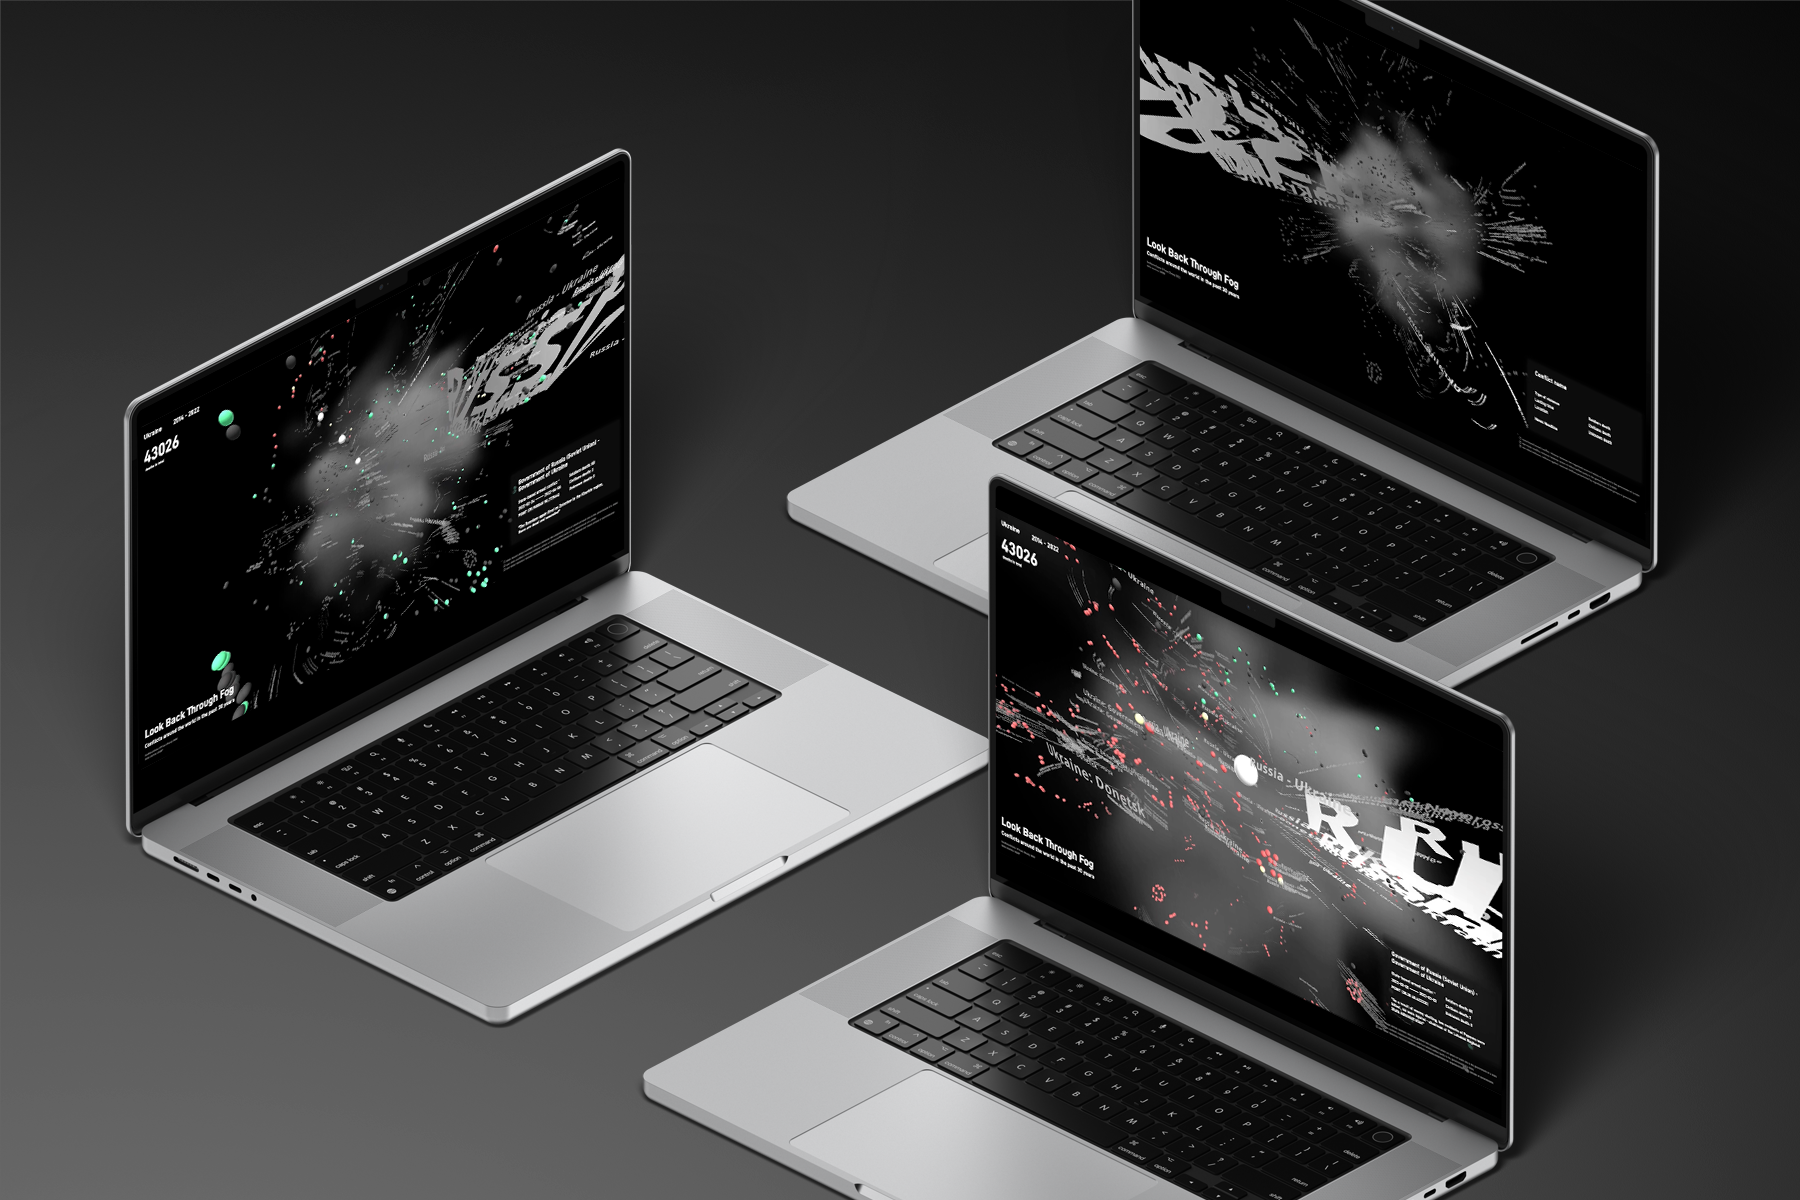


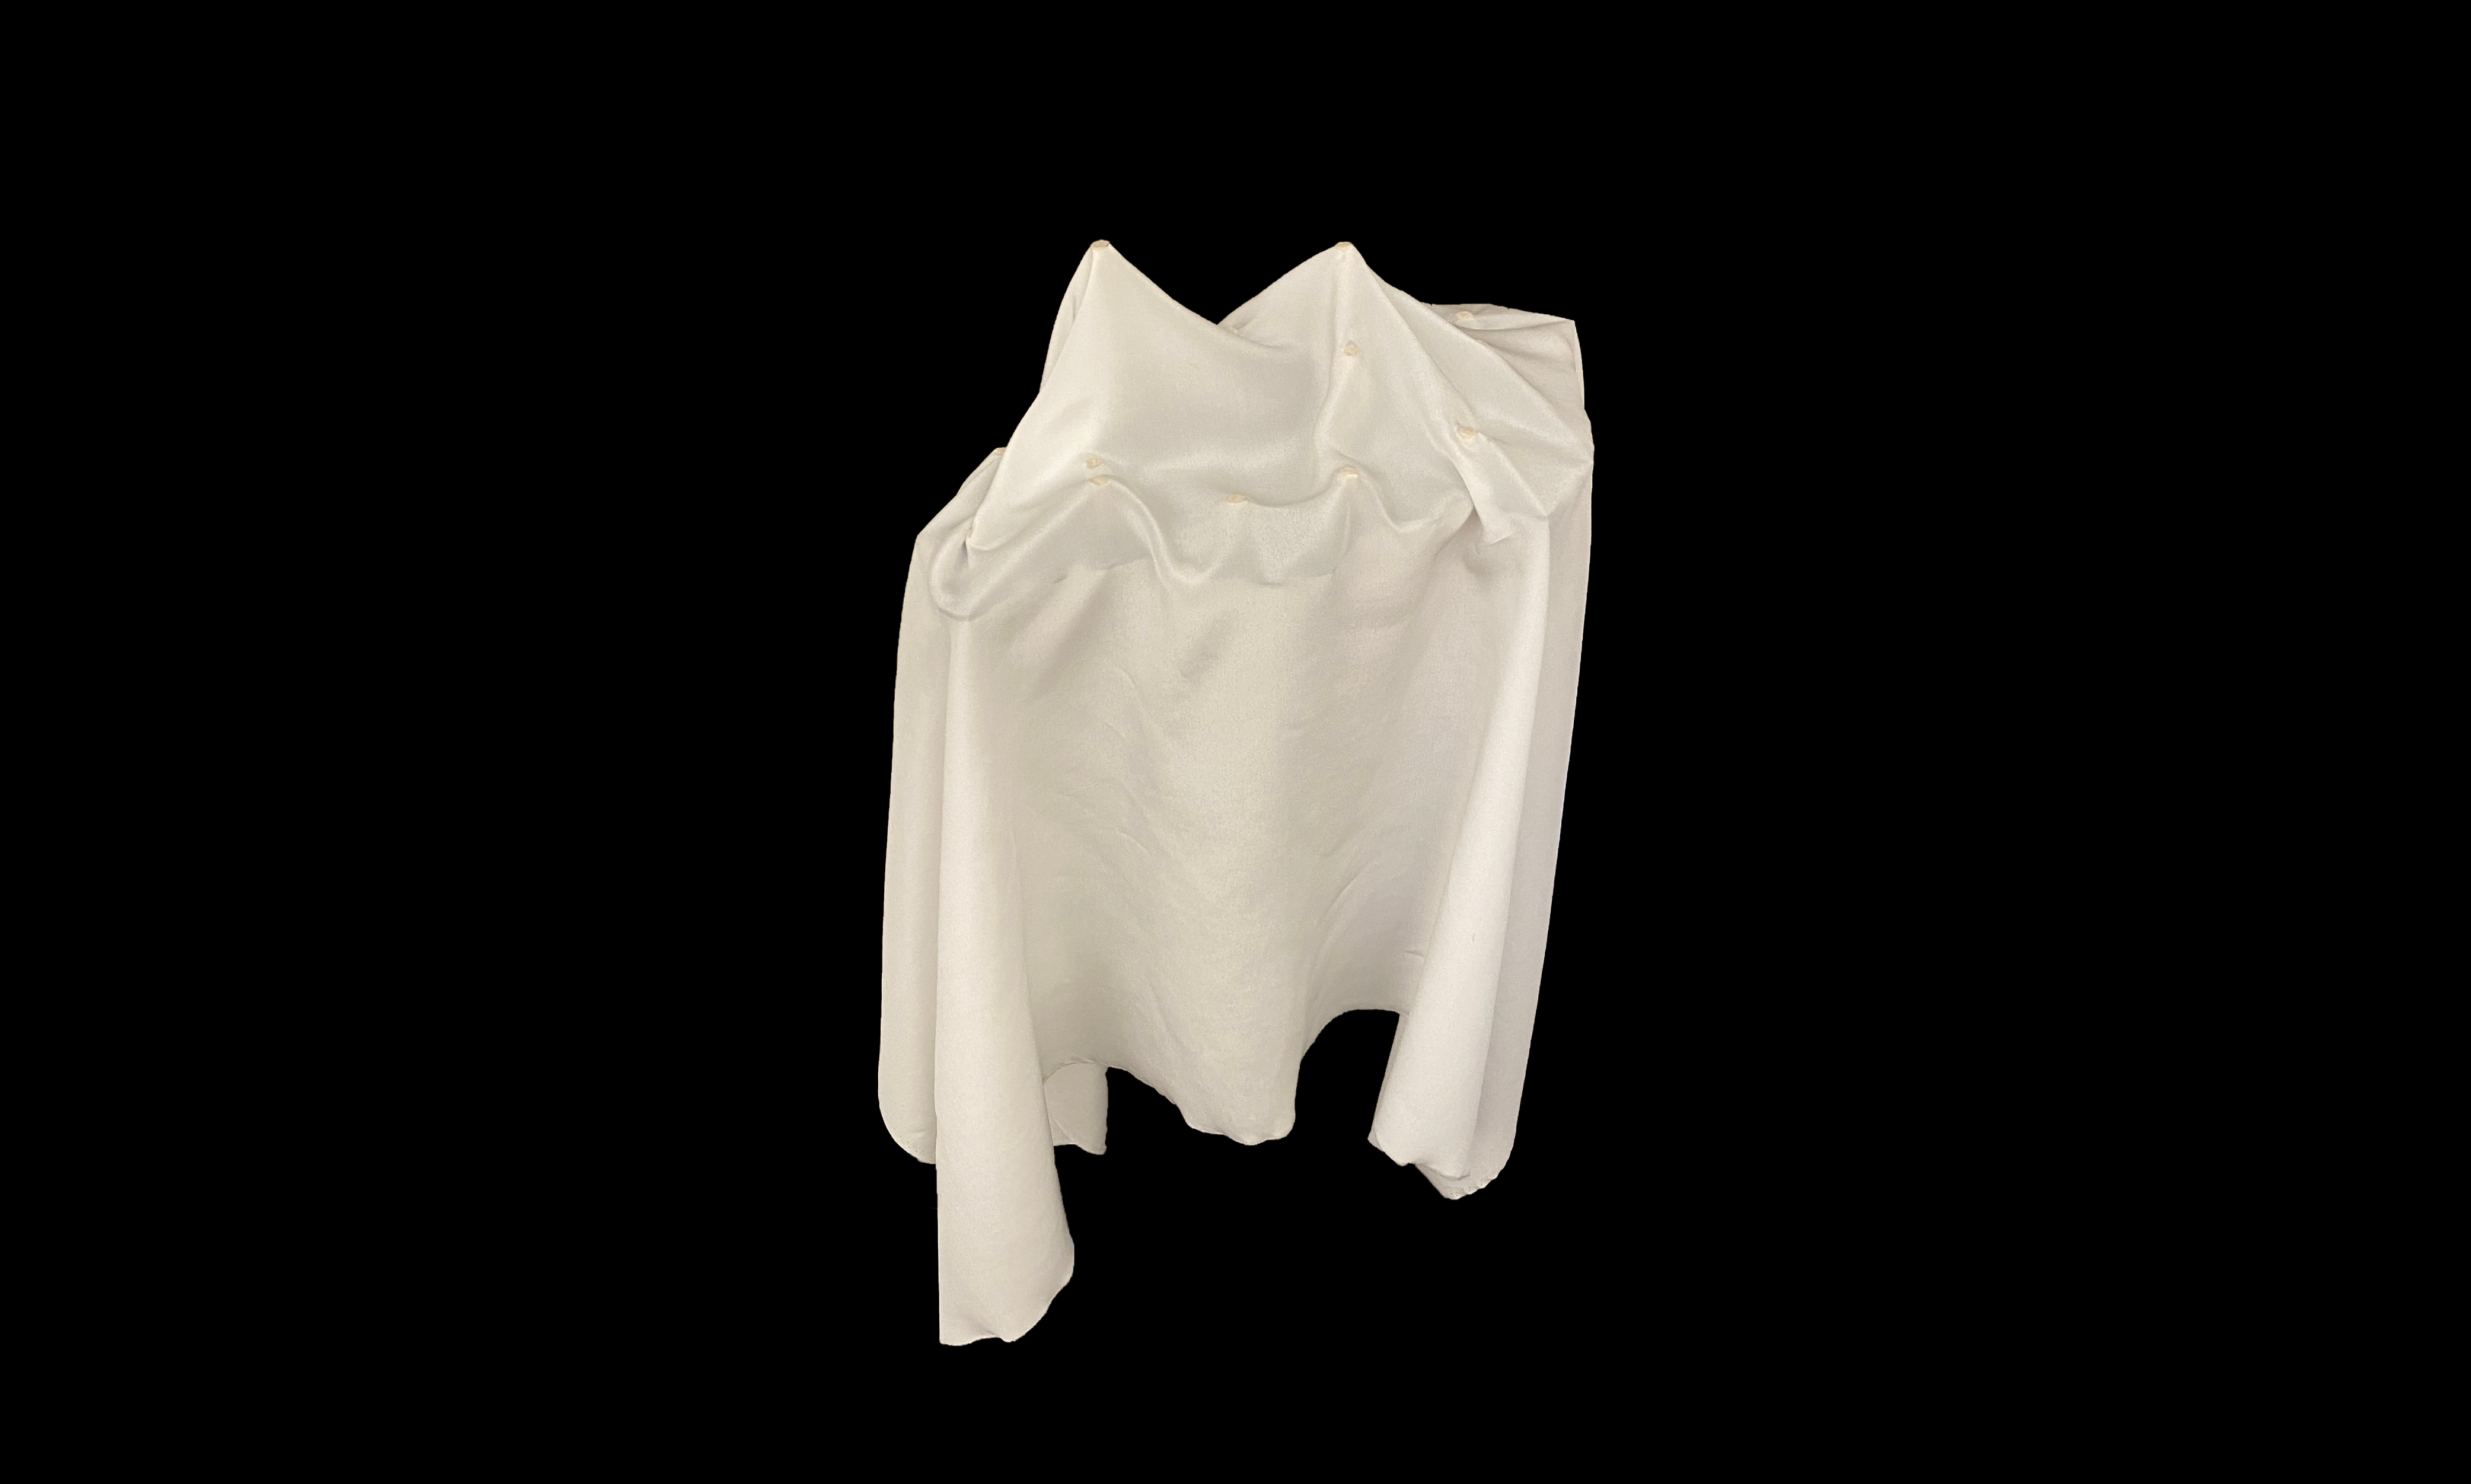
I took 18 countries with the highest number of deaths as samples and used the same algorithm to generate 18 data sculptures. Every sculpture records the war memory in different countries during last 30 years.
The shapes of fog reveal the death number by conflicts in different countries. Some of them are large which means there are more people died there, some of them have quite strange shape and protruding parts which means thousands of people lost their lives in one battle.
The shapes of fog reveal the death number by conflicts in different countries. Some of them are large which means there are more people died there, some of them have quite strange shape and protruding parts which means thousands of people lost their lives in one battle.

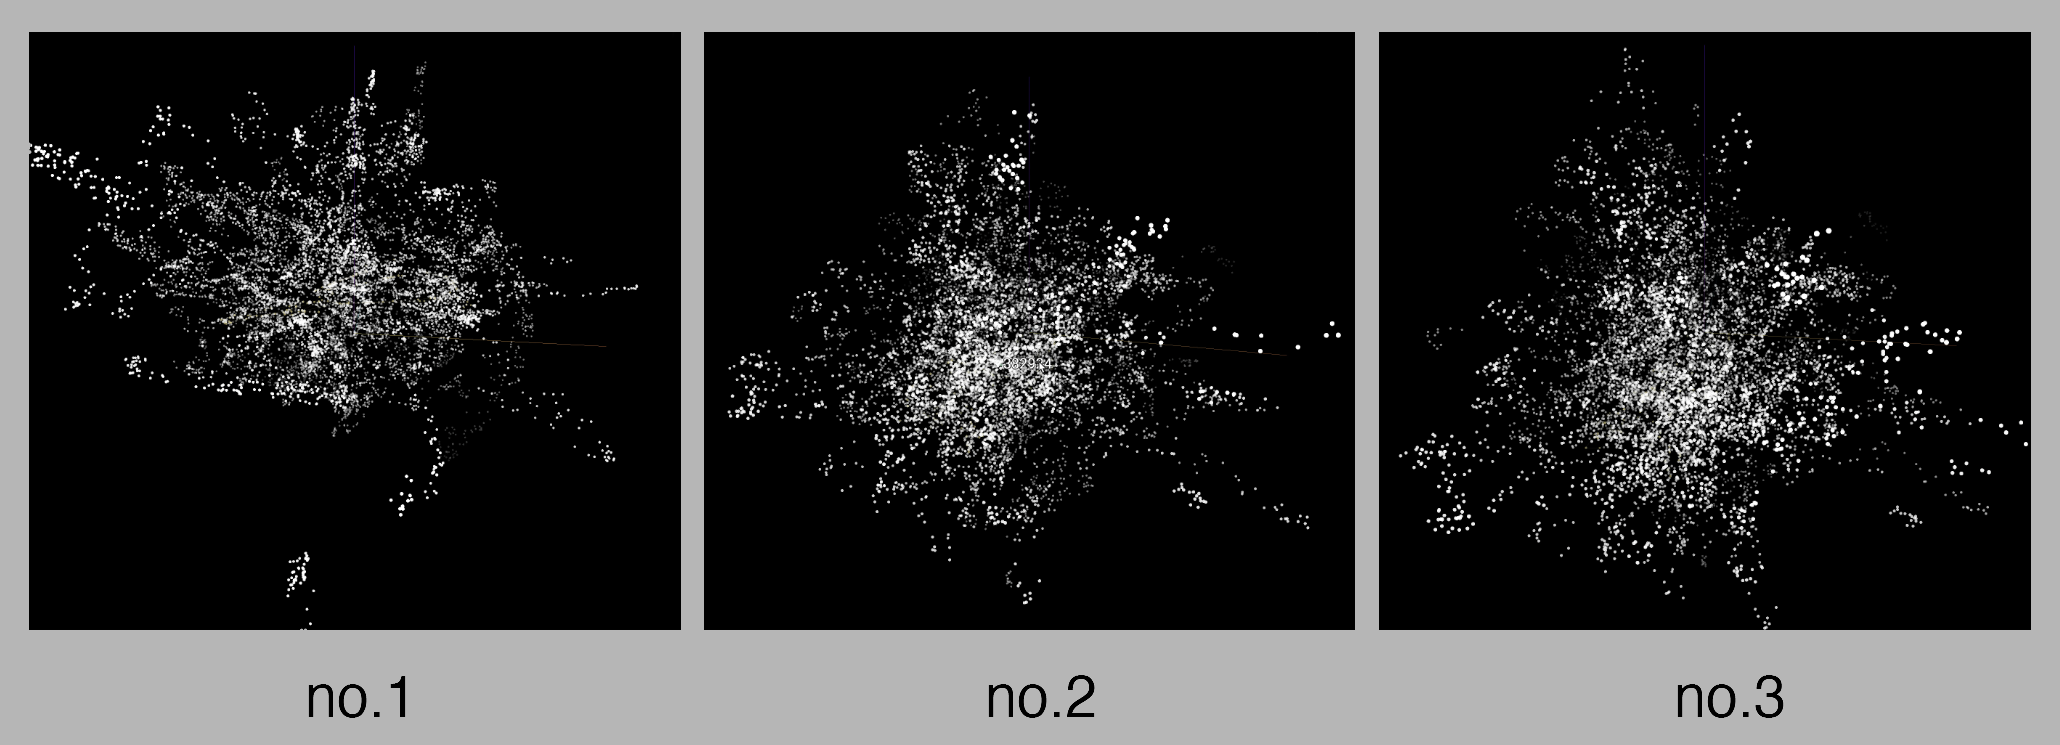
T-SNE algrithm is a machine learning method to reduce high data dimensions to low data dimensions. With t-SNE, it becomes possible to visualize high dimentional data set with scatter plot visualization by x, y, and z position. Each data point’s position is calculated by more than 20 attributes, such as solider death number, people death number, battel spot longitude, altitude, duration time, battle type, etc. Computer will place spots based on the information included by the event When the data points is closer, it represents that they are more relative in the perspective of machine learning.
Every time we use t-SNE to calculate the position of each data point, the shape will change because of the stochastic calculus. It seems like when we look back though the war history, the explosion of the war will happen again.
![]()
Every time we use t-SNE to calculate the position of each data point, the shape will change because of the stochastic calculus. It seems like when we look back though the war history, the explosion of the war will happen again.
Sketches